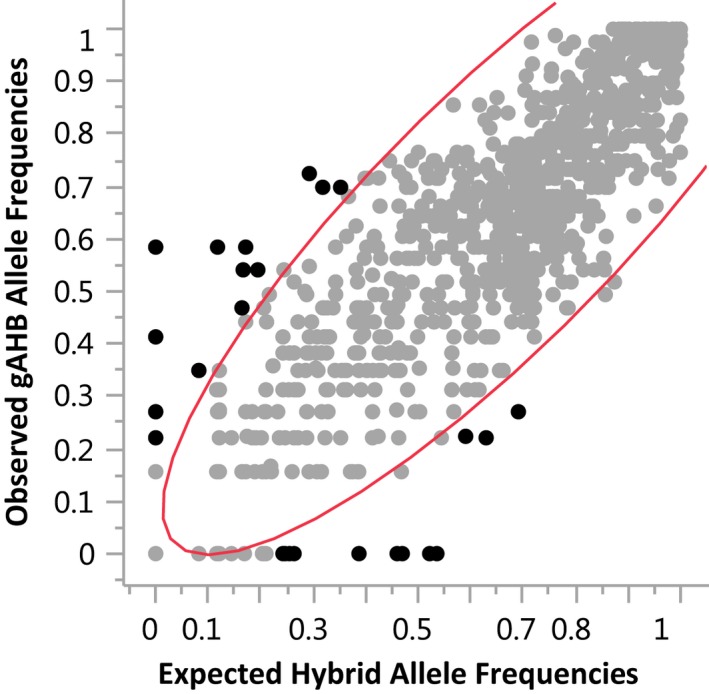
Figure 5.

Scatterplot matrix showing the correlation coefficients, comparing all SNPs markers allele frequencies across a calculated hybrid frequency of AHB (from Arizona and Texas samples) and EHB bees (Texas and Managed colonies) in the sample of gAHB allele frequencies
