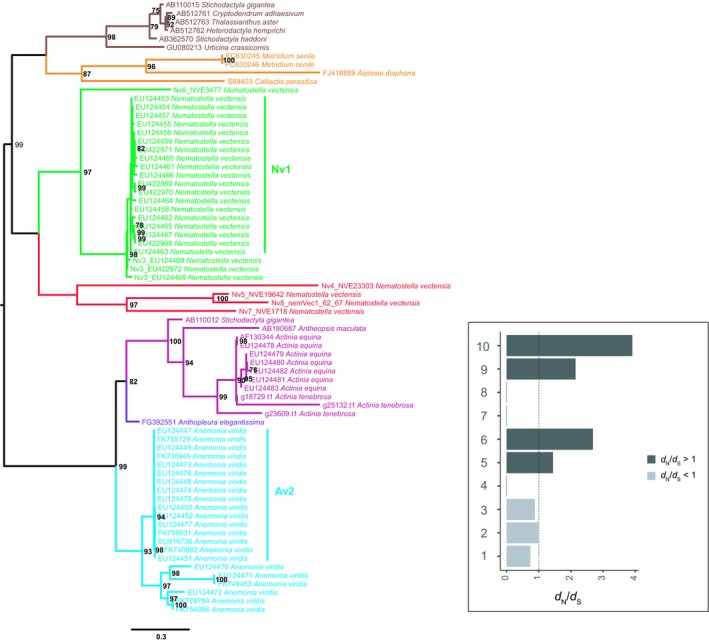
Figure 5.

Maximum‐likelihood tree with midpoint root depicting relationships among NaTx coding sequences. Bootstrap values after 1,000 iterations are shown next to nodes, values under 70% not reported. The GenBank accession numbers for the protein‐coding gene used in this phylogenetic analysis are described in Sunagar and Moran (2015) and Sachkova et al. (2019). A corresponding bar plot is provided which shows the computed dN/dS value for orthologs and paralogs. 1 = Actiniaria orthologs, 2 = Actinia orthologs, 3 = Nematostella vectensis paralogs, 4 = Actinia equina paralogs, 5 = Actinia tenebrosa paralogs, 6 = Anemonia viridis paralogs, 7 = Nv1 paralogs, 8 = Av2 paralogs, 9 = Nematostella vectensis paralogs diverged, and 10 = Anemonia viridis paralogs diverged
