
Figure 5.
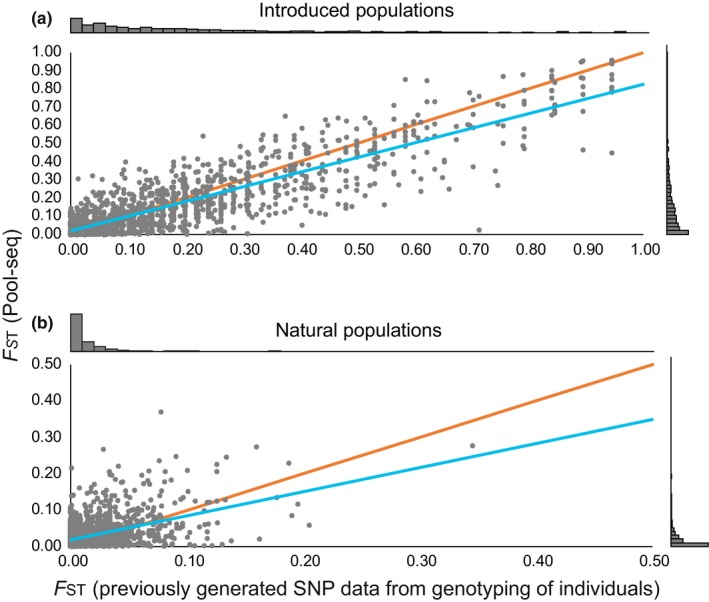
F ST values from Pool‐seq analyses (y‐axes) compared to those from previous individual SNP genotyping of the same SNP loci (x‐axes; data from Andersson, Jansson, et al., 2017 and L. Laikre & N. Ryman, unpublished data). Nei's F ST computed as F ST = 1−H S/H T was used for the previous SNP data, while for Pool‐seq, Nei's F ST was computed using POPOOLATION v. 1.2.2. (a) Pairwise F ST for 1,415 SNP loci for the introduced population (linear regression coefficient b = 0.81, r 2= 0.76, t = 68, p < 0.001). (b) Pairwise F ST for 1,378 SNP loci for the naturally sympatric populations (linear regression coefficient b = 0.66, r 2 = 0.21, t = 19, p < 0.001). The blue lines are linear regression trend lines, and the orange ones represent expected values with r2 = 1. Histograms in the margins represent frequency distributions of F ST values