
Figure 1.
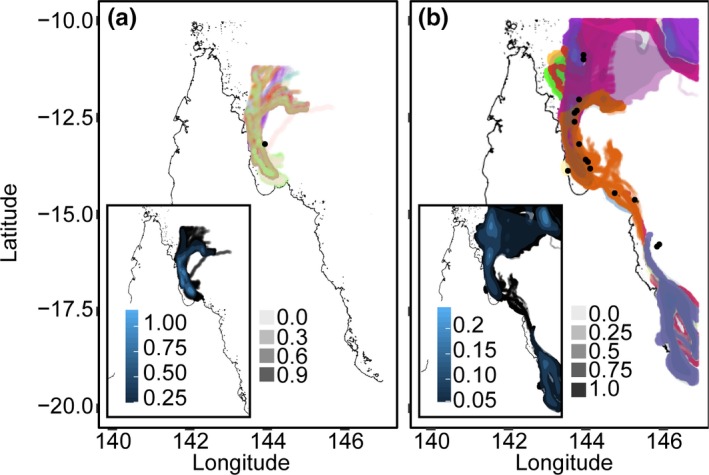
Connie II oceanographic larval dispersal modeling from single (a, inset, black dot corresponds to Tijou reef) and 15 larval release sites (b, inset, multiple black dots). Colors correspond to either replicate dispersal runs for the single reef (a) or for runs for different reefs (b, replicates not shown for clarity). Shading per color (as depicted by lighter to darker color shading) corresponds to calculated probabilities of larvae being in particular locations. Blue shading within insets corresponds to accumulated probabilities of larvae being in particular locations across different replicate runs and different reefs. Dark blue corresponds to locations with the highest accumulated probabilities of larvae (insets within a and b)