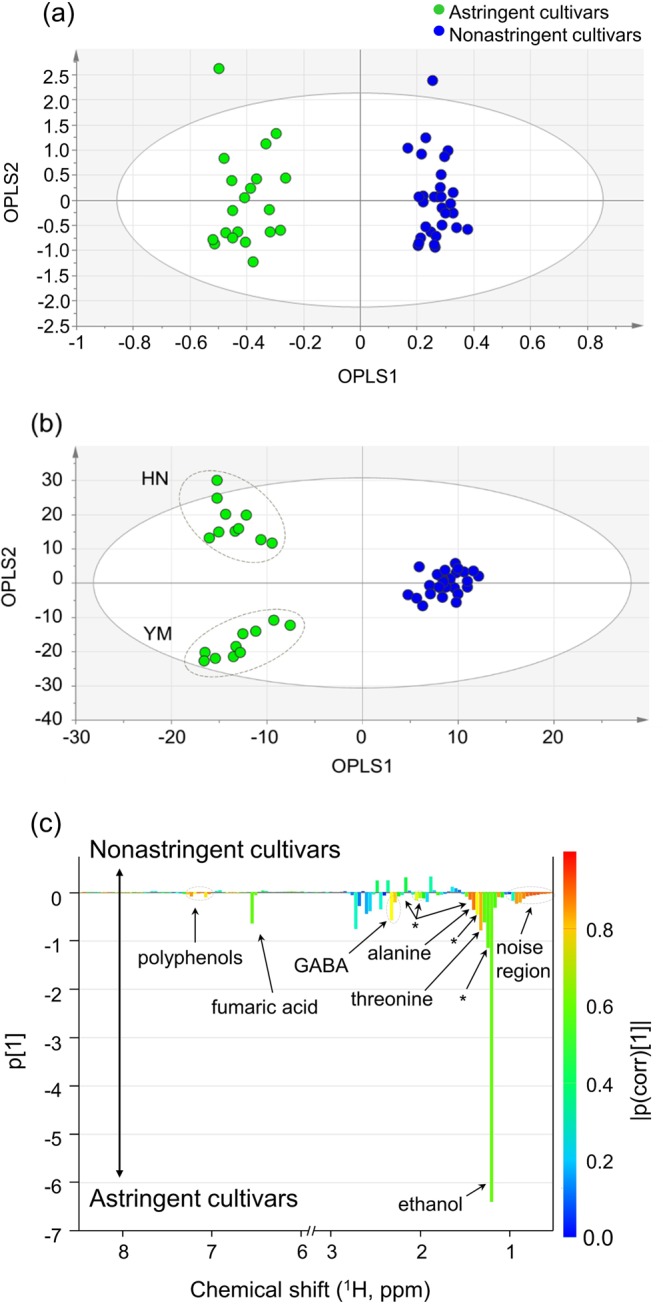
Figure 4.

(a) OPLS-DA score plot for five cultivars derived from 1H NMR spectra with the regions for water and sugars (between 3.0 ppm and 5.6 ppm) excluded. The variances were 8.8% and 54.4% for OPLS1 and OPLS2, respectively. The goodness-of-fit parameters R2x and R2y were 0.940 and 0.966, respectively, and the Q2 value was 0.761. (b) OPLS-DA score plot and (c) OPLS-DA loading plot of five cultivars derived from broadband WET spectra with the water and sugar saturation regions within 3.0 to 5.6 ppm excluded. HN and YM represent the Hiratanenashi and Yotsumizo cultivars, respectively. Asterisks denote unknown components. The variances were 23.1% and 27.5% for OPLS1 and OPLS2, respectively. The goodness-of-fit parameters R2x and R2y were 0.870 and 0.965, respectively, and the Q2 value was 0.936.
