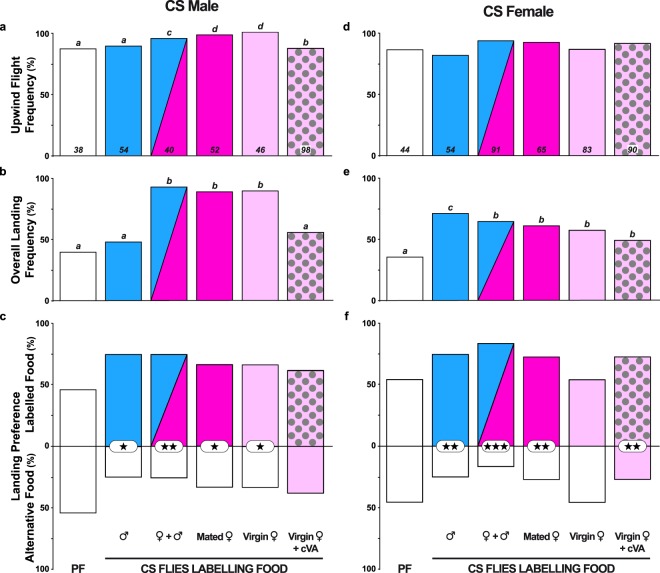
Figure 2.
Flight and landing preference in single CS flies tested for food labelled by CS flies. The histograms represent (a,d) the frequency of flies taking upwind flight (calculated from the total number of flies tested: see the bottom of each histogram bar), (b,e) the overall landing frequency (calculated from flying individuals), and (c,f) the landing preferences of mature male (c) and female CS flies (f). The coloured fill of the bars indicates the sex and mating status of the CS flies labelling the food (labelled food = LF; indicated below the histograms). The blue and pink colours indicate food labelled by males and females, respectively. Light and dark pink colours indicate labelling by virgin and mated females, respectively. The mixed blue/dark pink histogram bar indicates food labelled by both sexes (mixed sex). The light pink bar with dark spots (right bar) indicates food labelled by virgin females and enriched with synthetic cis-vaccenyl acetate (cVA). The white bar on the left represents plain food (PF; without fly labelling). In all experiments, the flies were tested through a binary choice involving PF and LF, except in the control test (left bar: PF/PF) and the test involving “virgin CS female odours vs. virgin CS female odours + cVA” (right bars). Therefore, the bars above and below the baseline show the proportion of flies choosing each food type. For each sex, the difference between upwind flight and landing frequencies was tested with the Wilks G2 likelihood ratio test completed with a computation of significance by cell (Fisher’s exact test; significant differences at α = 0.05 are indicated by different letters above the bars), whereas landing preference was tested with the z-test, and the corresponding frequencies were compared between the different LFs using the Marascuilo procedure. For the two frequency parameters, significant differences are indicated by different letters at α = 0.05, while the level of significance for food preference is represented (or not) by asterisks (*α < 0.05; **α < 0.01; ***α < 0.001; no asterisk: not significant). (a) Wilks G2 likelihood ratio test, G2(5df) = 16.6, p = 0.005; (b) G2(5df) = 61.2, p < 10−4; (c) Marascuilo procedure, Khi2(5df) = 4.4, p = 0.494; (d) G2(5df) = 6.6, p = 0.249; (e) G2(5df) = 15.3, p = 0.009; (f) Khi2(5df) = 12.0, p = 0.035.

