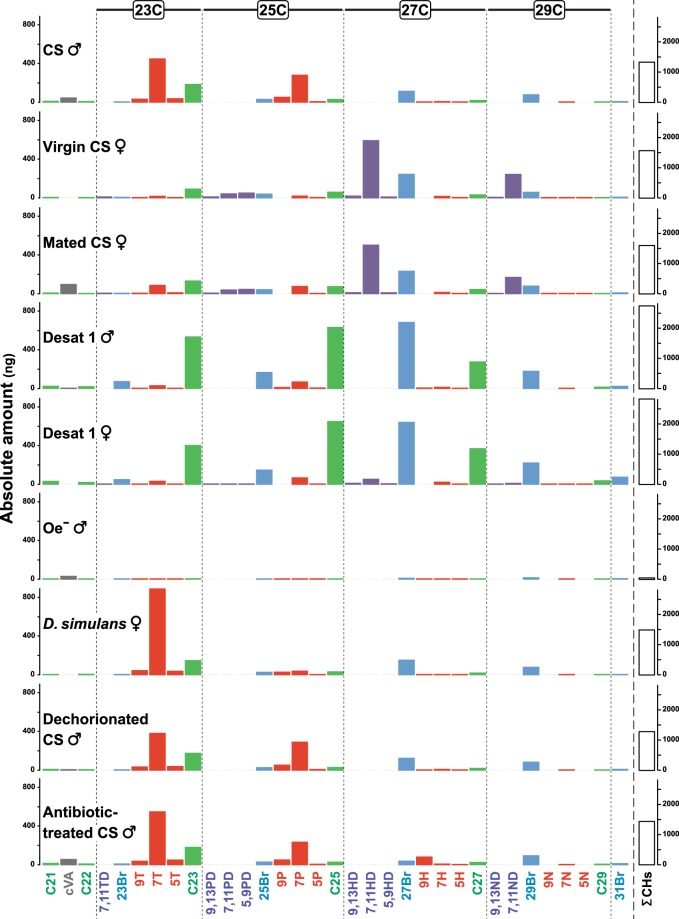
Figure 3.
Chemical profiles of the flies labelling the food. For each fly genotype (indicated on the left), the mean absolute contents (in ng) of the principal cuticular hydrocarbons (CHs) detected and cVA are shown. For the sake of clarity, CHs were separated based on their chain length (indicated above the histograms for 23 to 29 carbons (C23-C29, and below histogram bars on the left for the lighter CHs with 21 and 22 carbons (C21, C22). The sum of CHs (∑CHs; in ng) is represented with unfilled bars on the right. N = 20 flies except for the Desat1 males and females, where N = 15. For the nomenclature of chemicals and fly line identity, please refer to Table S1 and Fig. 4.

