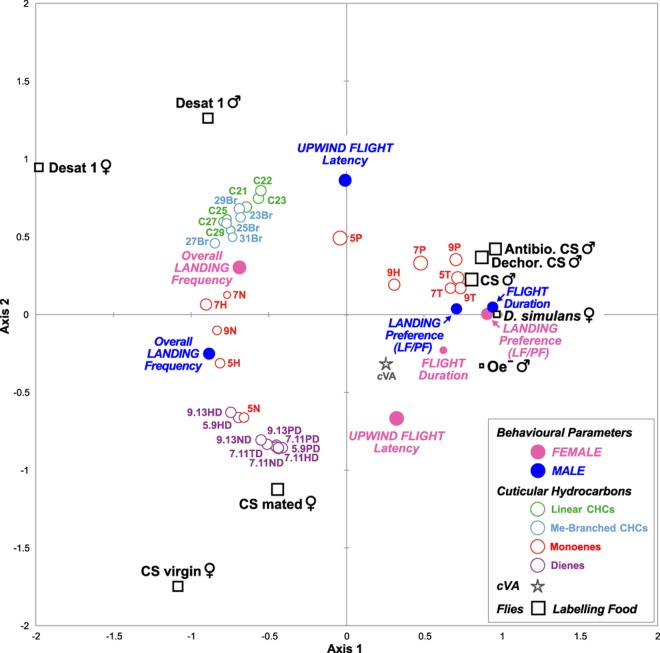
Figure 5.
Statistical relationship between chemicals, flight parameters and labelling flies. Three-dimensional plot of the 3 first axes of the principal component analysis (PCA; type Pearson’s correlation matrix; with standardized values) using relevant flight parameters (upwind flight latency, flight duration, overall landing frequency), landing preference (labelled food vs. plain food = LF/PF) and the relative proportions of each hydrocarbon and cVA detected in the cuticular extract of labelling flies as variables and the “labelling” fly types as individuals. The 3rd dimension (axis 3) is represented by the size of the symbols (circle, square, star). These three first PCA axes explain 84.5% of the total variation of our sample (axis 1 = 43.2%, axis 2 = 31.4%, axis 3 = 9.9%). Blue and pink filled circles represent male and female flight parameters, respectively. The star represents cVA, while empty circles represent the content of CHs carried by the labelling flies (red = monoenes; purple = dienes; blue = methyl-branched CHs; green = linear CHs). The fly lines used to label food are represented by empty black squares.

