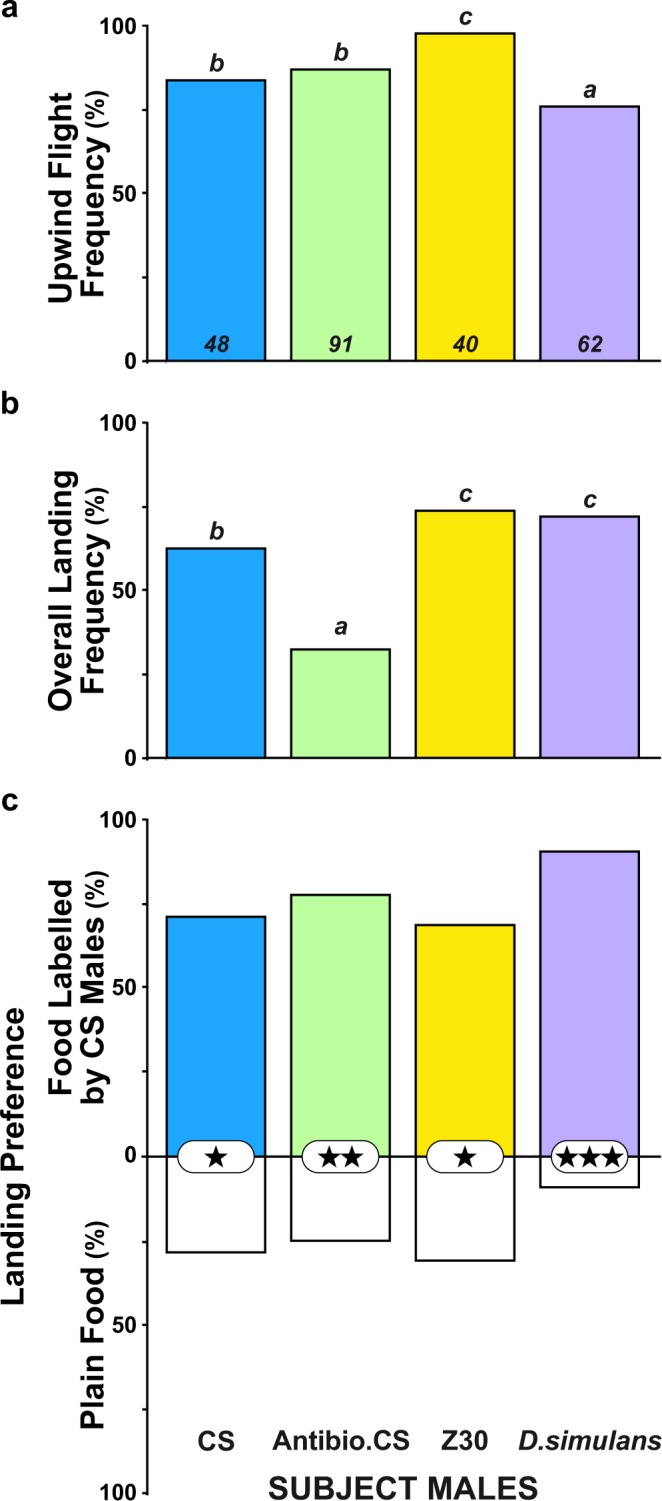
Figure 6.

Free flight and landing preference in single male flies from various genotypes toward food labelled by CS males. Histograms represent (a) the frequency of flies taking upwind flight, (b) the overall landing frequency, and (c) the landing preference between plain food (PF; empty bars) and food labelled by CS males (coloured bars). In addition to CS control males (blue coloured bars), we tested the response of individual males derived from CS antibiotic-treated eggs (Antibio. CS males; green coloured bars), from the Zimbabwe30 wild-type line (Z30; yellow coloured bars), and from D. simulans (D. simulans; purple coloured bars). For parameters and statistics, please refer to the Fig. 2 legend. (a) G2(3df) = 11.0, p = 0.012; (b) G2(3df) = 7.9, p = 0.049; (c) Khi2(3df) = 5.5, p = 0.142. The sample size is indicated at the bottom of each histogram bar (a).
