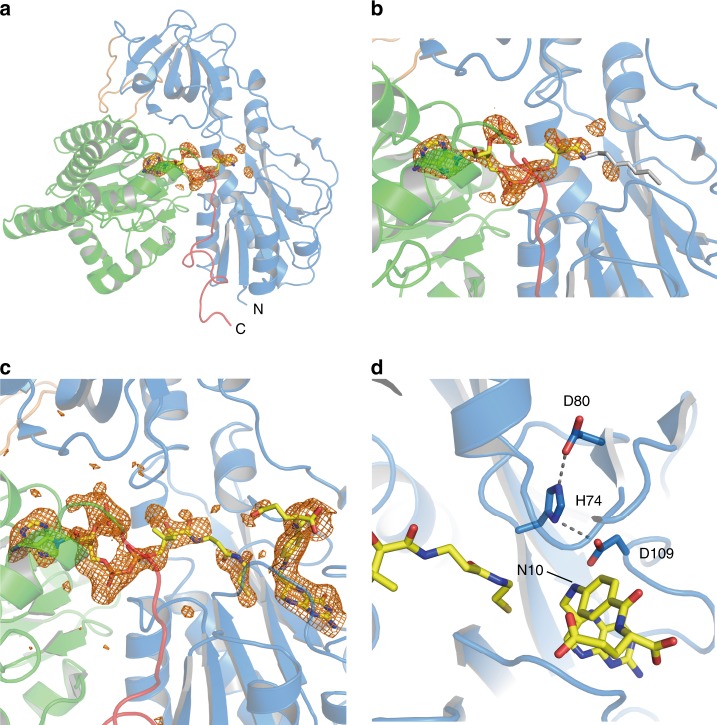
Fig. 7.
a Structure of the A392F-I419F variant (PDB ID: 6J1I) with the electron density map (Fo-Fc polder omit map shown in an orange mesh) contoured at 3σ for CoA. In the A392F-I419F variant, the occupancy and average B-factor of CoA are 0.89 and 110.4 Å2, respectively. b Close-up view of CoA binding region in the A392F-I419F variant, in which CoA adopts the extended conformation. c Structure of THF-bound A392F-I419F variant (PDB ID: 6J1J). The electron density maps for CoA and THF (Fo-Fc polder omit map shown in orange mesh) are contoured at 3σ. In the THF-bound A392F-I419F variant, the occupancy and average B-factor of CoA are 0.85 and 90.4 Å2, respectively. d Hydrogen bonding network among the catalytic triad in the A392F-I419F variant. CoA, THF, and side chains of His74, Asp80, and Asp109 are shown in the stick model

