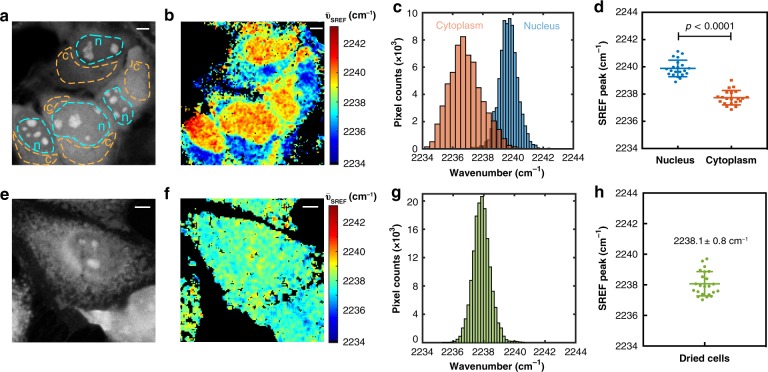
Fig. 3.
Mapping water heterogeneity in live cells. a A representative intensity-based SREF image of Rh800 stained living HeLa cells (pump = 836 nm). b Heterogeneous map of nitrile peak frequency. c Nitrile peak frequency histogram of two regions (n for nucleus and c for cytoplasm, marked in c with dash line) in live HeLa cells. d Nitriles peak frequency distribution (mean ± s.d.) of nucleus (2239.9 ± 0.6 cm−1) and cytoplasm (2237.7 ± 0.5 cm−1) among 21 HeLa cells. p < 0.0001 for two-sided paired t-test, n = 21. e A representative SREF image (pump = 836 nm) of ethanol-dried HeLa cells stained by Rh800. f Fitted frequency map shows the heterogeneities between nucleus and cytoplasm disappear for dried cells. g Nitrile peak frequency histogram of (f) indicating a single-group distribution. h Nitrile peak frequency distribution of 23 dried HeLa cells (mean ± s.d., 2238.1 ± 0.8 cm−1). Scale bar: 5 μm. Error bars represent standard deviations

