Fig. 3.
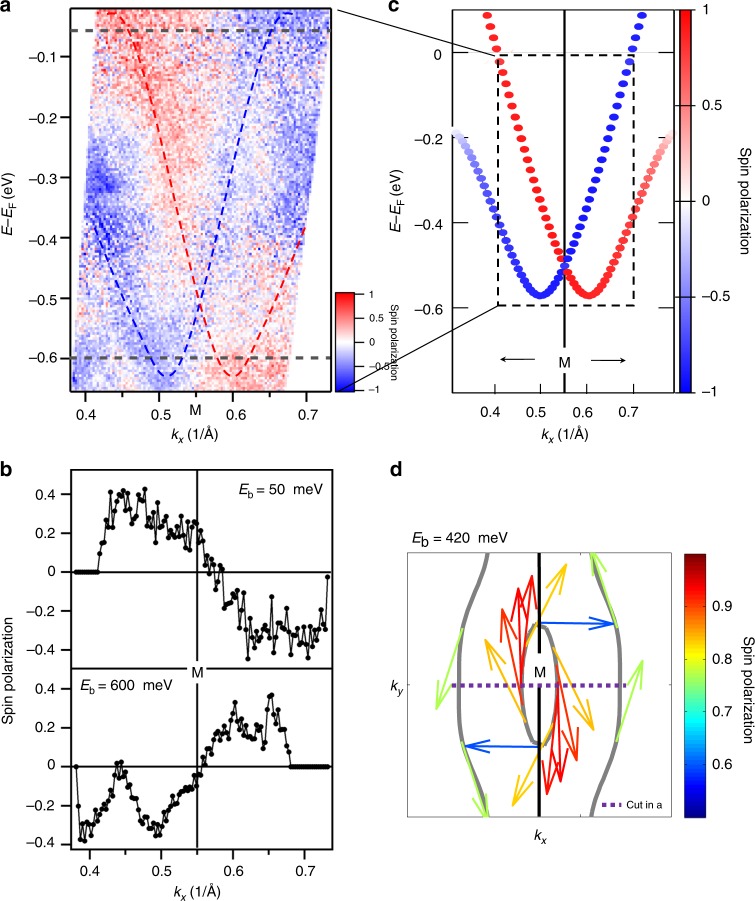
Spin texture of the Rashba-like splitting. a Spin-resolved band image around the M point along Γ–M–Γ (kx) measured by spin-resolved and angle-resolved photoemission spectroscopy (SARPES) (hν = 8.4 eV). The red and blue lines indicate the locations of the Rashba-split bands, while the horizontal gray dashed lines indicate the energy positions of the momentum distribution curves (MDCs) in b. b MDCs of spin polarization at Eb = 50 and 600 meV extracted from the data in a. c Calculated spin polarization of the Rashba-split bands (ky = kz = 0). d Spin texture on the constant-energy contours around M point at Eb = 420 meV. Arrows indicate the spin direction while their color indicates the degree of spin polarization. It has been checked that the experimental data in b exhibits the same spin chirality as the calculated data in d. The scale bars in a, c, and d represent spin polarization

