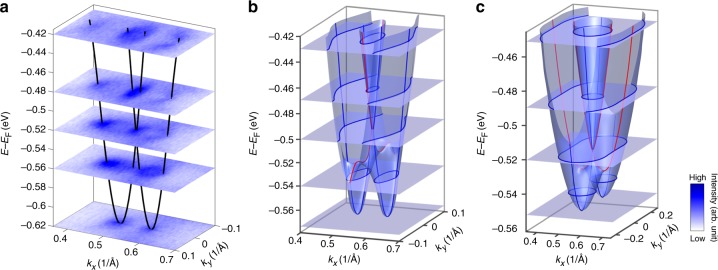
Fig. 4.
3D electronic structure of the Rashba-like splitting. a 3D E(kx, ky) map from angle-resolved photoemission spectroscopy (ARPES) data (hν = 9 eV). The black lines indicate the Rashba-split bands. Different surfaces correspond to constant-energy contours at different binding energies. b Calculated 3D electronic structure of PtBi2 at the M point. The red lines indicate the Rashba-split dispersion along M–K (ky) direction, while the blue lines indicate the Rashba-split dispersion along M–Γ (kx) direction. c Calculated 3D electronic structure considering only pure Rashba SOC, taking effective masses from the ARPES data. The blue lines indicate the Rashba-split dispersion along M–K (ky) direction, while the red lines indicate the Rashba-split dispersion along M–Γ (kx) direction. Both red (blue) lines in b, c indicate dispersions with smaller (larger) band splitting. The gray surfaces with blue lines on them in b, c sketch out the constant-energy contours at different binding energies

