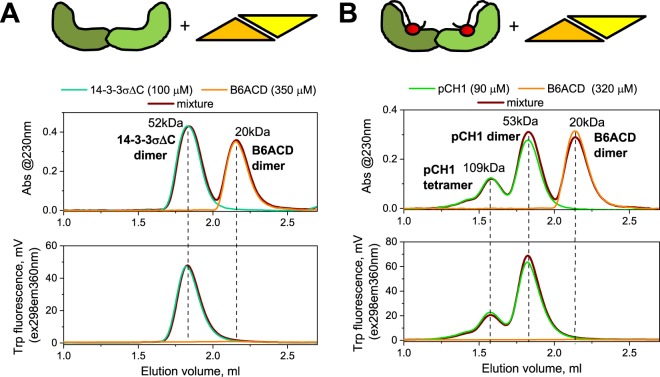
Figure 5.
Lack of interaction between the isolated ACD and either 14-3-3σ∆C (A) or the 14-3-3-phosphopeptide chimera pCH1. (B) These two scenarios, shown schematically on top of the panels, were examined by size-exclusion chromatography with simultaneous detection by 230 nm absorbance and Trp-specific fluorescence (excitation 298 nm, emission 360 nm). Concentrations of 14-3-3 and ACD are indicated in µM. Dashed lines show the positions of the main peaks on different profiles for clarity.

