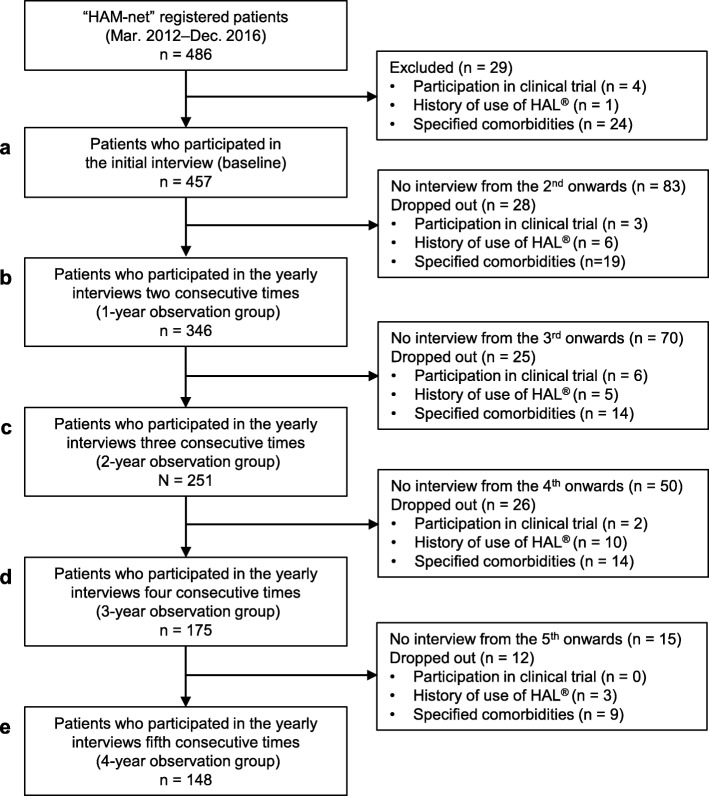
Fig. 2.
Flowchart for showing analysis sets to assess motor function in HAM/TSP (analysis set 2). To examine the chronological change of OMDS in patients with HAM/TSP, we excluded those who had factors that could affect the evaluation of lower limb motor function from 486 patients using specific exclusion/dropout criteria (see Methods for details). This cohort is referred to as “analysis set 2” in this paper. Furthermore, to accurately evaluate yearly changes in OMDS, we limited “analysis set 2” to patients whose interval between each survey date fell within 275–455 days (365 ± 90 days). The right half of this chart shows the number of patients who were excluded at each step and the reasons why. After being excluded by the criteria, there were 457 patients at the time of the initial interview (a). We used both the one-year observation group (n = 346, b) andthe four-year observation group (n = 148, e) for analysis. The two-year observation and the three-year observation groups consisted of 251 (c) and 175 patients (d), respectively

