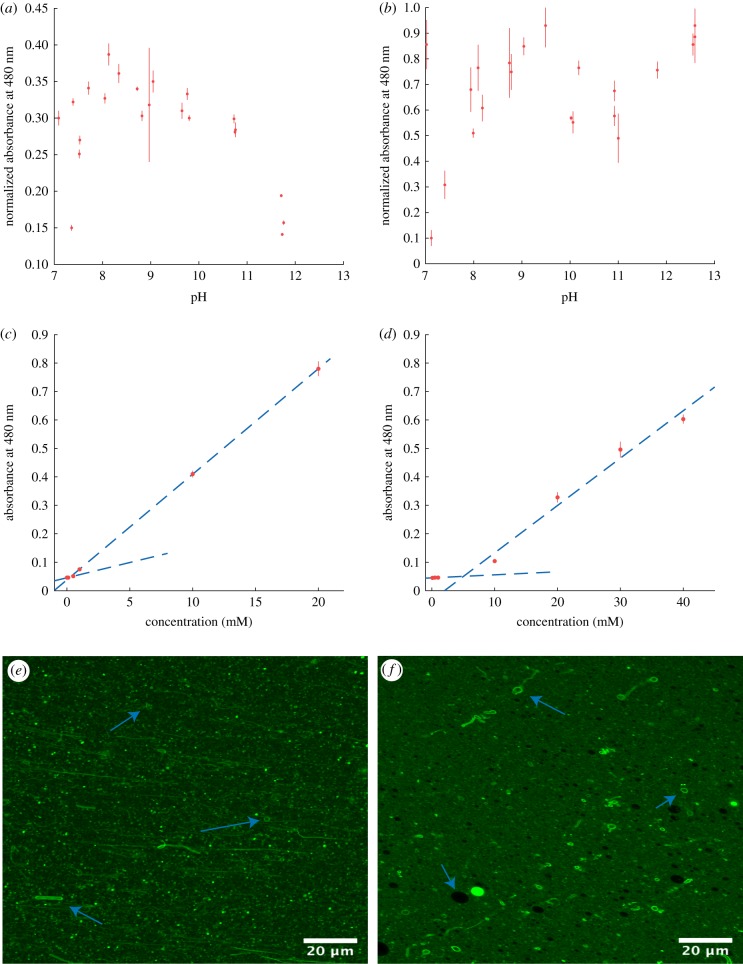
Figure 2.
(a) OD data for 50 mM 1 : 1 DA/DOH solutions from pH 7 to 13. (b) OD data for 50 mM 1 : 1 DA/GOH solutions from pH 7 to 13. (c) Plot of absorbance at 480 nm versus concentration (mM) for DA/DOH. The intersection of the two trendlines indicates the CBC of 157 µM. (d) Plot of absorbance at 480 nm versus concentration (mM) for DA/GOH. The intersection of the two trendlines indicates the CBC of 4.9 mM. (e) Confocal micrograph of DA/DOH in H2O at pH 12.1. (f) Confocal micrograph of DA/GOH in H2O at pH 11.6. Arrows indicate individual vesicles in solution. (Online version in colour.)

