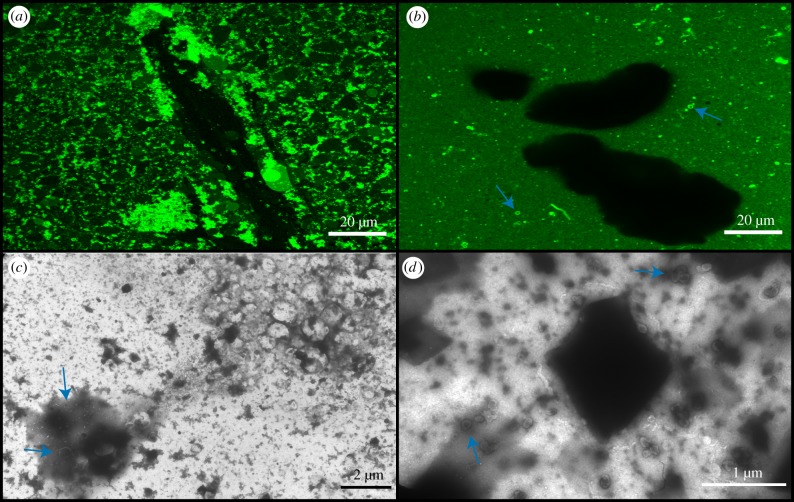
Figure 8.
Confocal and TEM micrographs of anoxic solutions prepared in H2O followed by addition of Fe powder (less than 212 µm mesh). (a) Confocal micrograph of DA/DOH at pH 12.1, (b) confocal micrograph of DA/GOH at pH 12.1, (c) TEM micrograph of DA/DOH at pH 12.2, (d) TEM micrograph of DA/GOH at pH 12.1. Vesicles are indicated by blue arrows. (Online version in colour.)

