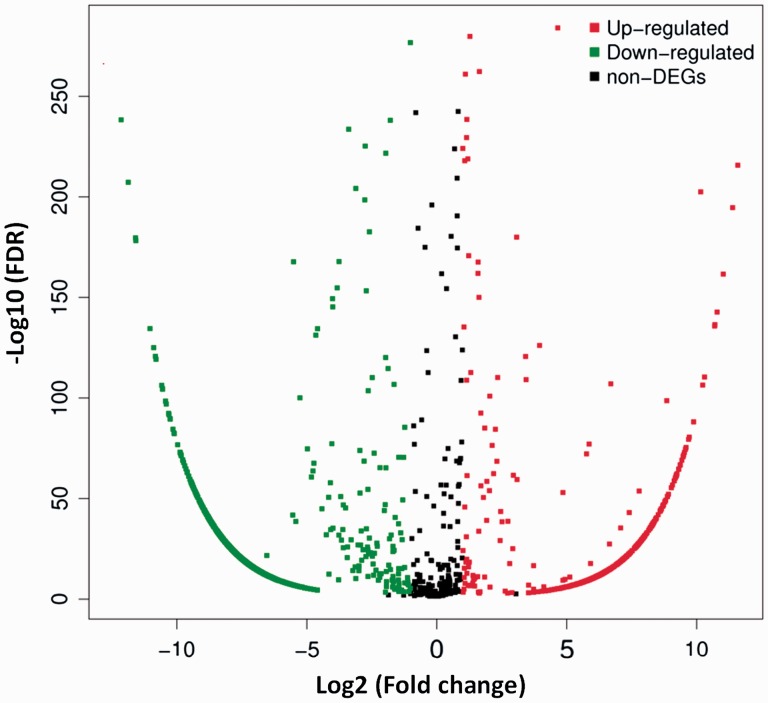
Figure 3.
Distribution of DEmiRNAs. The X axis is the log2 (Fold change) of DEmiRNAs, the Y axis is the −log10 (FDR) of DEmiRNAs. The red points indicate 899 up-regulated DEmiRNAs [log2 (Fold change) ≥1 and FDR ≤0.001]. The green points indicate 908 down-regulated DEmiRNAs [log2 (Fold change) ≤ −1 and FDR ≤ 0.001]. (A color version of this figure is available in the online journal.)

