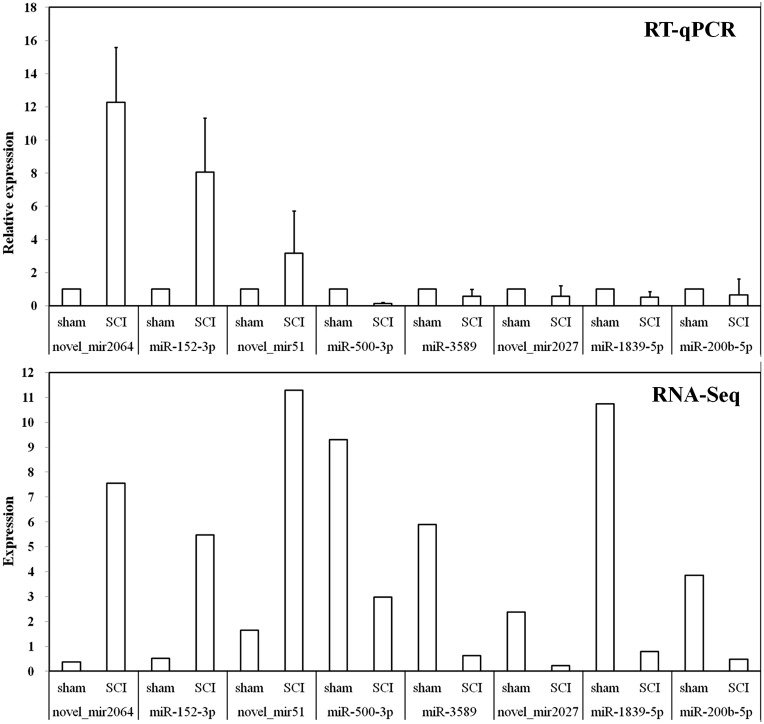
Figure 5.
RT-qPCR validations of DEmiRNAs characterized by sRNA-Seq. The ΔΔCt method was used to calculate the relative expression levels of DEmiRNAs in SCI group versus sham group (designated as 1). All data were calculated with mean ± standard deviation (n = 3). The longitudinal coordinates in RNA-Seq were the expression levels of DEmiRNAs calculated by using TPM, which can be used directly to compare gene expression differences between the samples.

