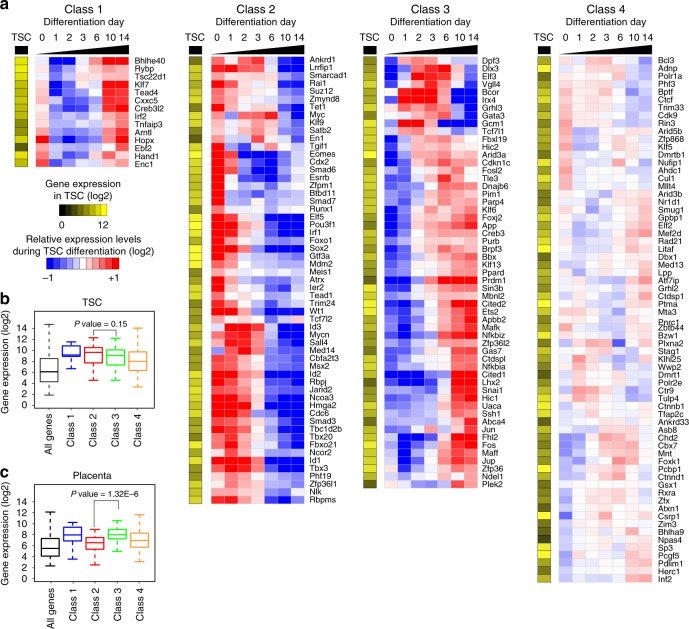
Fig. 2.
Four different classes of SE-associated TFs. a Heatmaps illustrating four distinct SE-associated TF groups that show unique expression pattern during time-course differentiation of TSCs. Relative gene expression was calculated by dividing the level of a gene with average gene expression across time points. Absolute gene expression level in self-renewing TSCs was also shown in a single column heatmap beside the time-course heatmaps. b, c A boxplot showing distribution of expression levels of genes in four classes and all genes as a control in TSCs (b) and placenta (c). Lower and upper bounds of the box indicate the first and third quartiles, respectively. A horizontal line near the middle of the box shows the median, while whiskers extend from the box to the smallest (largest) datum not further than 1.5 times of the interquartile range. Statistical significance was determined by two-tailed, Wilcoxon test

