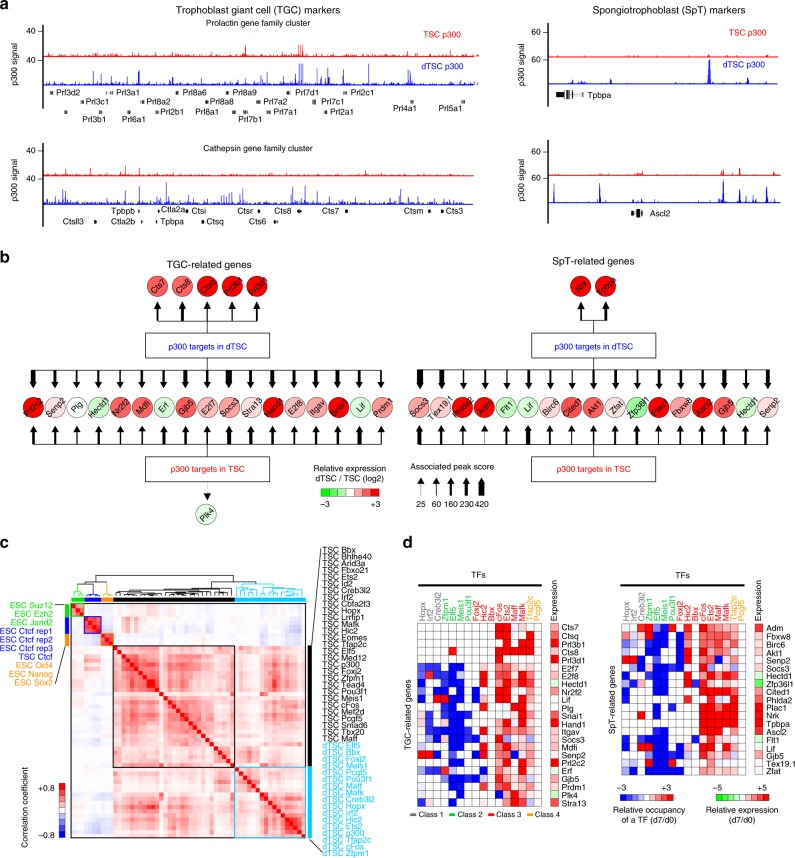
Fig. 4.
Dynamic changes of enhancers’ landscape and occupancy of TSC-specific TFs during differentiation of TSCs. a Signal track images depicting occupancy of p300 around TGC (left panel) and SpT (right panel) markers in TSCs (red) and dTSCs (blue). b p300 occupancy networks of TGC (left panel) and SpT (right panel) marker genes in TSCs and dTSCs. Thickness of an arrow indicates occupancy score of p300. Relative gene expression (dTSCs/TSCs) is shown with color-coded heatmap. c A correlation heatmap of various TFs’ occupancy. Different functional classes of genes are color coded (Ctcf: blue; pluripotency factors: orange; PRC complex: green; TFs in TSCs: black; TFs in dTSCs: sky blue). Gradient color scale bar on the left indicates correlation coefficients. d Heatmaps depicting relative occupancy of TFs (dTSCs/TSCs) in TGC-related (left panel) and SpT-related (right panel) genes. Relative gene expression level (dTSCs/TSCs) is shown right beside the heatmaps

