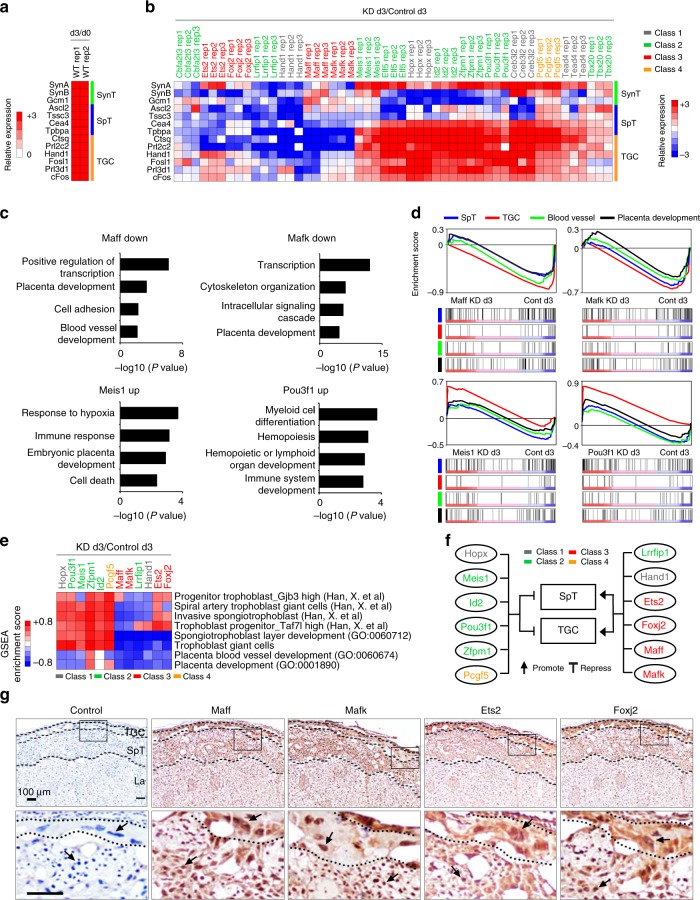
Fig. 5.
Distinct roles of TSC-specific TFs in lineage specification. a A heatmap showing relative expression level of each lineage markers upon differentiation (d3). Marker genes of each lineage are shown in Y-axis. b A heatmap presenting relative expression level of lineage marker genes between a TSC-specific TF knockdown (KD) cells and control cells after 3 days of differentiation. X-axis shows TFs that were knocked down. Marker genes of each lineage are shown in Y-axis. c Enriched GO terms in differentially expressed genes (DEGs) that are directly regulated by TSC-specific TFs. d Gene set enrichment analyses (GSEA) of global gene expression profiles, obtained from KD of TFs and control followed by 3 days of differentiation, on diverse groups of genes representing specific placenta-related GO terms. e Heatmap showing Enrichment score from GSEA of RNA-seq data obtained from KD of TFs and control followed by 3 days of differentiation on specific placenta-related terms and cell types. Red and blue colors indicate promotion and inhibition of listed terms by KD of a TF, respectively. f A schematic diagram presenting regulatory roles of a TF on lineage development of TSCs. Genes and lineages/tissues are shown with oval and rectangular shapes, respectively. Class of each TF is labeled with different colors. g Immunohistochemistry of TSC-specific TFs in placenta. TGC, SpT, and La indicate trophoblast giant cell, spongiotrophoblast, and labyrinth, respectively. Each antibody used is shown at the top of the image and control indicates IgG control with hematoxylin staining. Small rectangular box in the upper panel shows an area magnified (bottom panel). An arrow indicates a representative cell in trophoblast lineage and a scale bar depicts 100 µm. Source data underlying Fig. 5a, b are provided as a Source Data file

