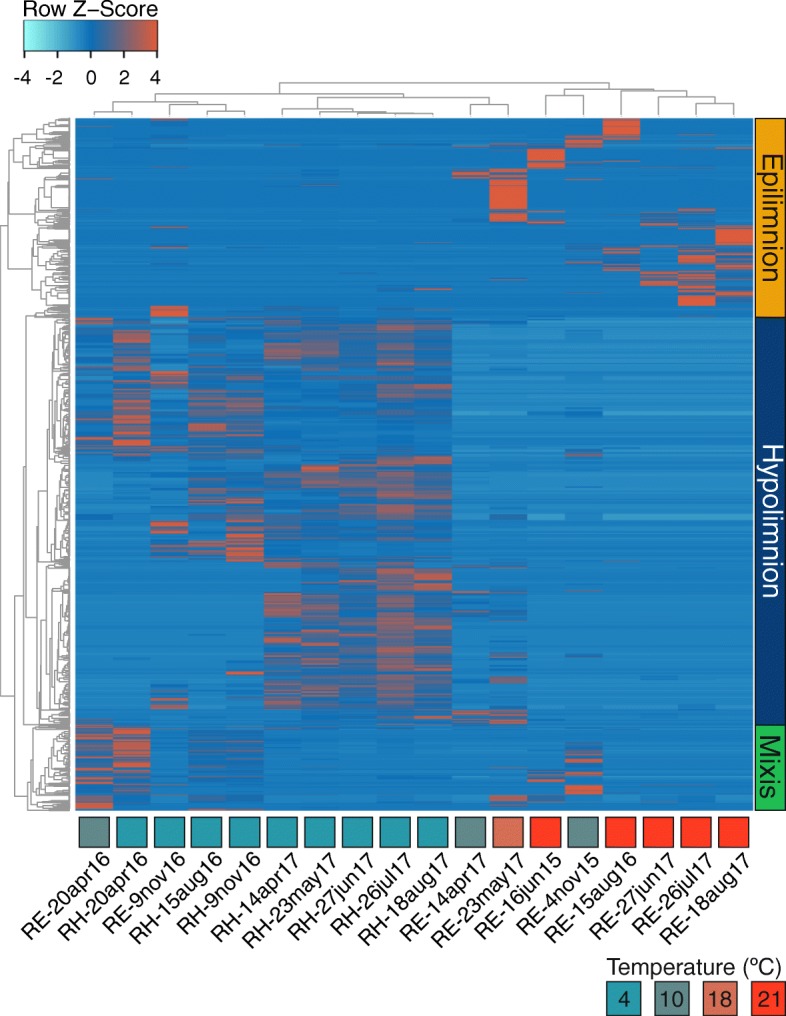
Fig. 3.

Relative abundance of 1398 Řimov phages in 18 metagenomes. A heatmap of abundances is shown (coverage/Gb of metagenome normalized by Z-score). Phages are clustered by sample and abundance (average linkage, Spearman rank correlation). Vertical bars on the right side indicate the classification of the clusters. Columns are annotated with the temperature, depth of the sample, and the sampling date (RE = 0.5 m and RH = 30 m). Temperature color key is shown at the top right
