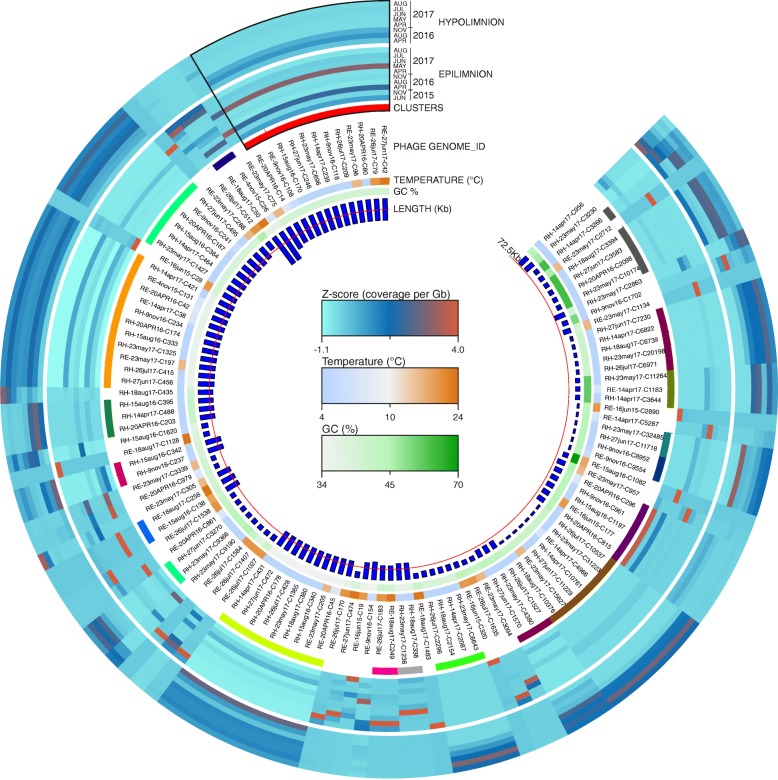
Fig. 4.
Abundance profiles of the WhiB encoding actinophages recovered from Řimov reservoir. Actinophages (n = 125) are arranged based on average amino acid identity (dendrogram not shown). From inside out the rings represent: phage genome size in kilobytes (red line indicates the average genome length, 72.5 Kb), phage genome GC%, water temperature of samples whereof phages were assembled, span of clusters of phage genomes grouped by similarity (nucleotide identity > 95%), abundance profiles of each actinophage in the epi- and hypolimnion time series datasets of Řimov reservoir (coverage per gigabase of metagenome normalized by Z-score). Color keys are shown at the center. Phages of Cluster1 are outlined in black (top left of the circle)

