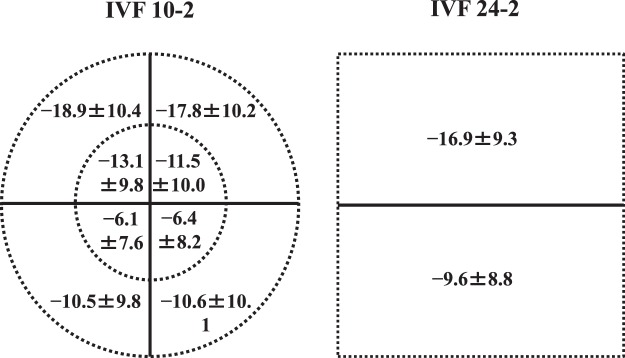
Figure 2.
Mean total deviations (mTDs) of subfields, as determined using the binocular integrated visual field (IVF) of the Humphrey Field Analyzer (HFA) Swedish Interactive Threshold Algorithm standard (SITA). Left: mTDs of eight quadrant subfields within 5° of the fixation point, as determined using the binocular IVF of HFA SITA 10-2. Right: mTDs of upper/lower hemifields as determined using the binocular IVF of HFA SITA 24-2. Values are presented as mean total deviation ± standard deviation (decibels) for each subfield.

