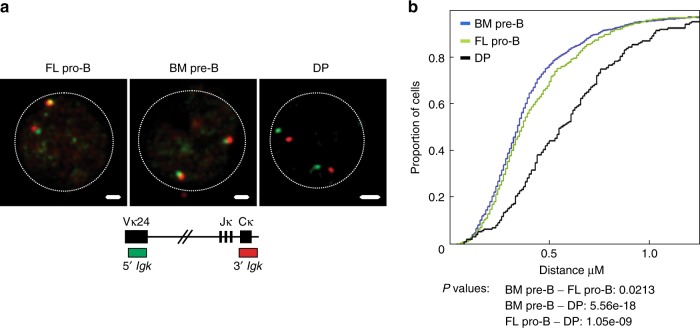
Fig. 2.
The Igk locus is similarly contracted in FL pro-B cells and BM pre-B cells. a Representative confocal microscopy images showing the distance separation between the probes on Igk in fetal liver pro-B cells (Lin−CD19+B220+IgM−CD2−CD117+), bone marrow pre-B cells (CD19+B220+IgM−CD117+CD25+), and double-positive T cells (CD90.2+TCRB−CD4+CD8+). b Distances separating the two ends of the locus are displayed as a cumulative frequency curve. A left shift on the curve is indicative of closer association. Bone marrow pre-B cells (blue), fetal liver pro-B cells (green), and negative control double-positive T cells (black). P-values were generated using two-sample Kolmogorov–Smirnov tests (n = 2 independent experiments)

