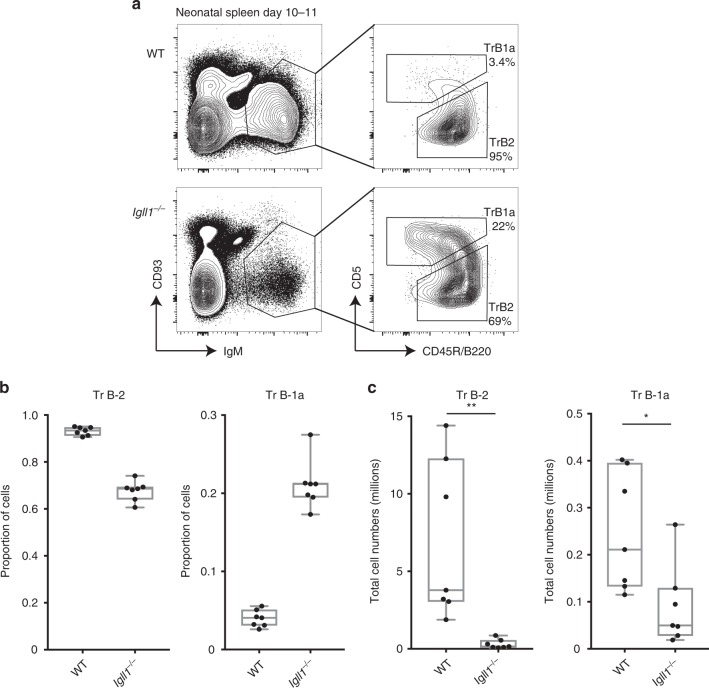
Fig. 5.
Transitional B-1a cells are readily detected in neonatal spleens from Igll1−/− mice. a Representative flow-cytometry plots showing transitional B-1a (CD19+CD93lo/intIgM+B220−/loCD5+) and transitional B-2 (CD19+CD93lo/intIgM+CD5−/loB220+) from wild-type and Igll1−/−. The left plot is gated on CD19+ cells from D10–11 neonatal spleen. b Graphs represent the proportion of cells that are either transitional B-1a or transitional B-2. c Graphs show the total cell numbers of transitional B-2 or transitional B-1a in millions. For both b and c, the middle line in the boxplots represents the median. The box shows first and third quartiles, and the whiskers represent the max and min values. Each dot represents cells from a different individual mouse. Source data are provided as Source Data File

