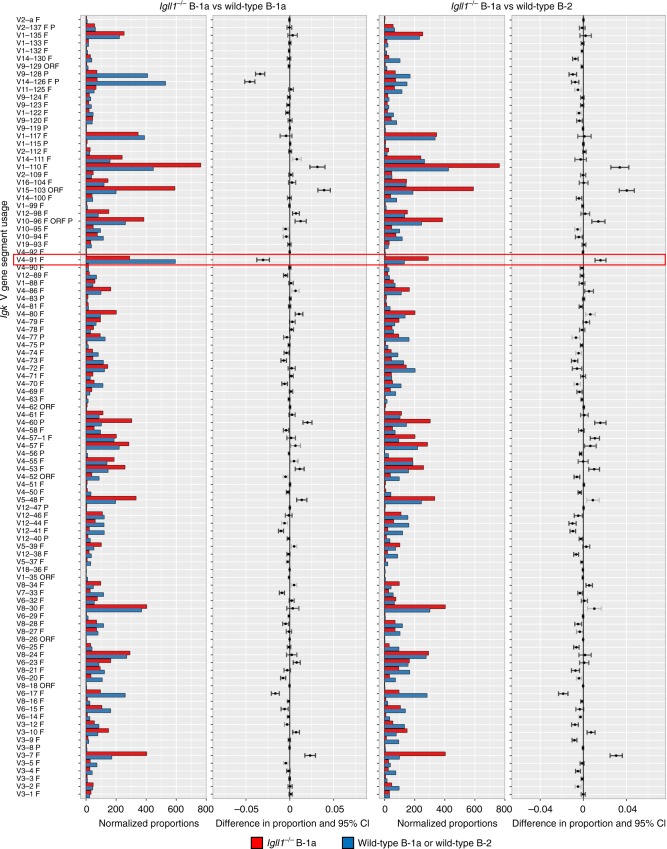
Fig. 8.
Wild-type and Igll1−/− Igll1−/− B-1a cells have a similar VK gene segment usage to wild-type controls and maintain VK4-91 enrichment. Representative synthesis graphs generated from IMGT/StatClonotype that compare differences in Igk V gene segment usage between Igll1−/− (red) versus wild-type (blue) peritoneal cavity B-1a cells CD19+B220loCD5+ (left side) or Igll1−/− (red) peritoneal cavity B-1a cells vs wild-type (blue) peritoneal cavity B-2 cells CD19+B220+ (right side). The red box highlights VK4 (VK4-91) gene segment (n = 2 independent experiments). This graph combines a bar graph for the normalized proportions of each gene segment and the differences in proportions with significance and confidence intervals (CI)

