
Fig. 4.
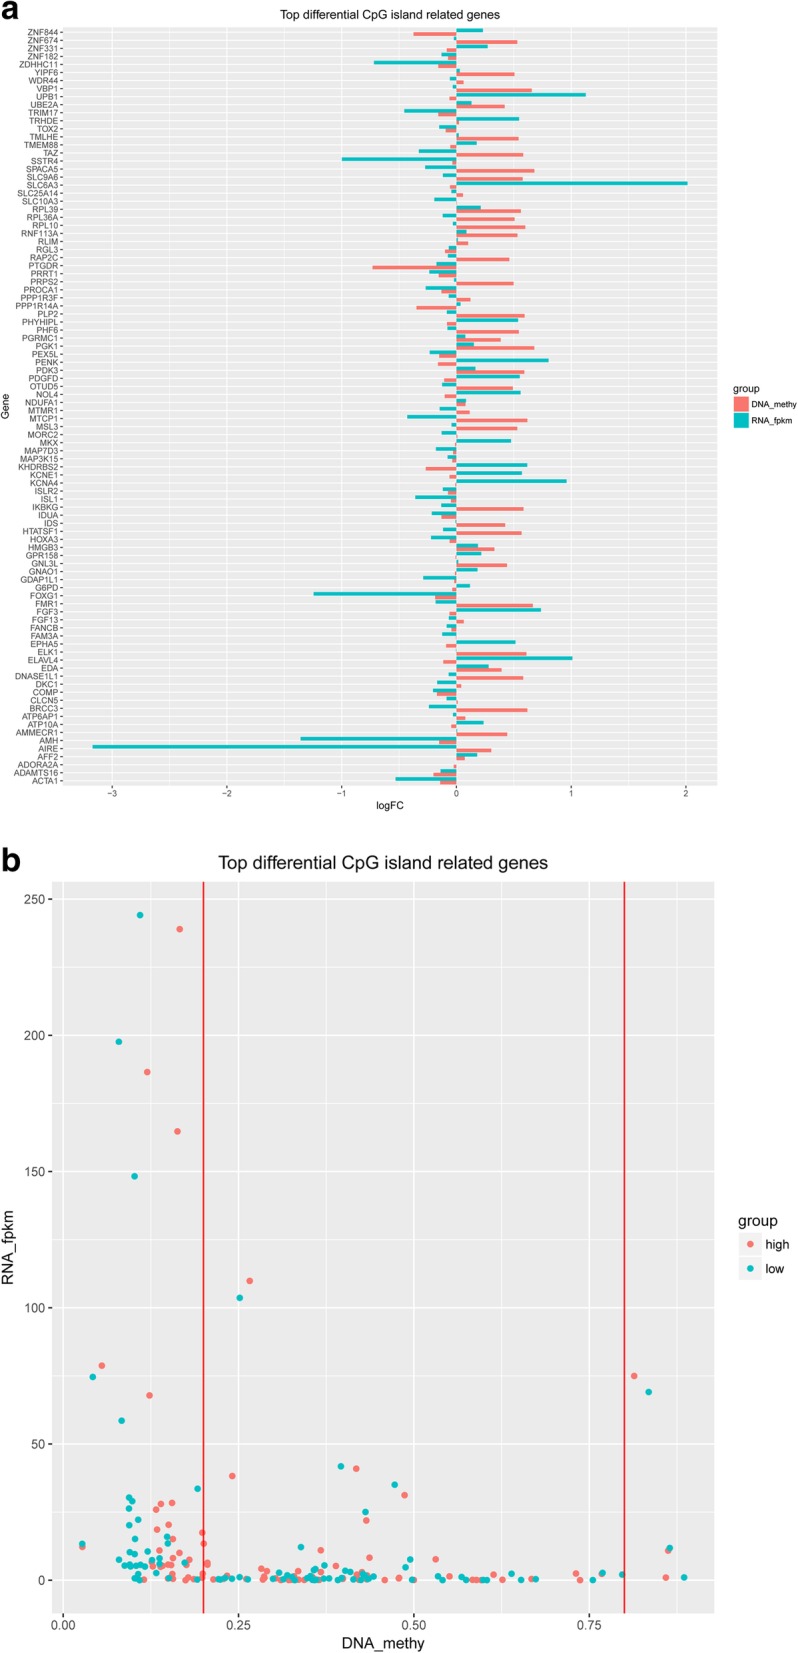
Top 50 significantly hyper/hypo methylated CpG islands annotated on 94 unique genes. (a) Represents DNA methylation status and gene ID in column plot (b) Represents DNA methylation status and gene ID in dot plot
Official websites use .gov
A
.gov website belongs to an official
government organization in the United States.
Secure .gov websites use HTTPS
A lock (
) or https:// means you've safely
connected to the .gov website. Share sensitive
information only on official, secure websites.
Top 50 significantly hyper/hypo methylated CpG islands annotated on 94 unique genes. (a) Represents DNA methylation status and gene ID in column plot (b) Represents DNA methylation status and gene ID in dot plot