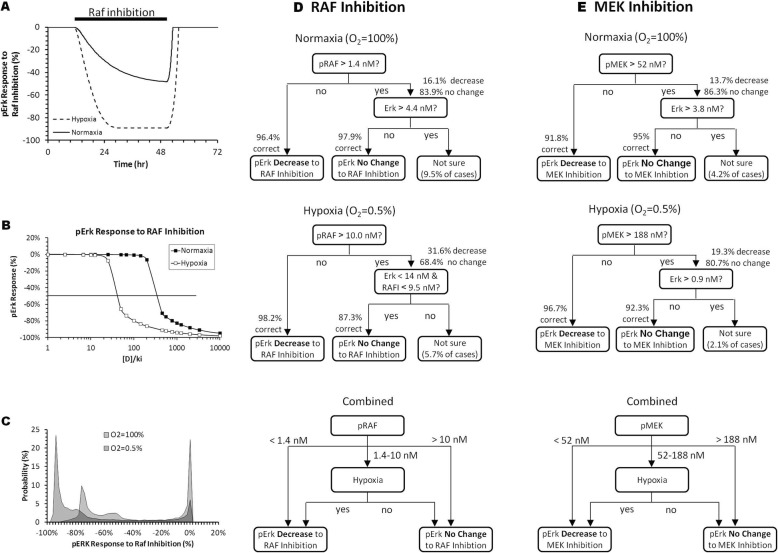
Fig. 5.
pRAF or pMEK concentration determines the level of pERK suppression by RAF or MEK inhibitors, respectively, under different hypoxic conditions. a One simulation case showing the pERK responses to inhibition of RAF phosphorylation under normoxia or sustained reduction of O2 from 100 to 0.5%. b Concentration response curves from one simulation case showing hypoxia increases the sensitivity of pERK reduction to inhibition of RAF phosphorylation. c Histograms summarizing the distribution of pERK responses to the same RAF inhibition from all 20,000 simulation cases under normoxia and hypoxia (0.5% O2). d and e Decision tree diagrams illustrating the key biomolecules dictating how pERK responses to inhibition of RAF or MEK phosphorylation. [D]/ki = 100 and 2000 for inhibition of RAF and MEK phosphorylation, respectively

