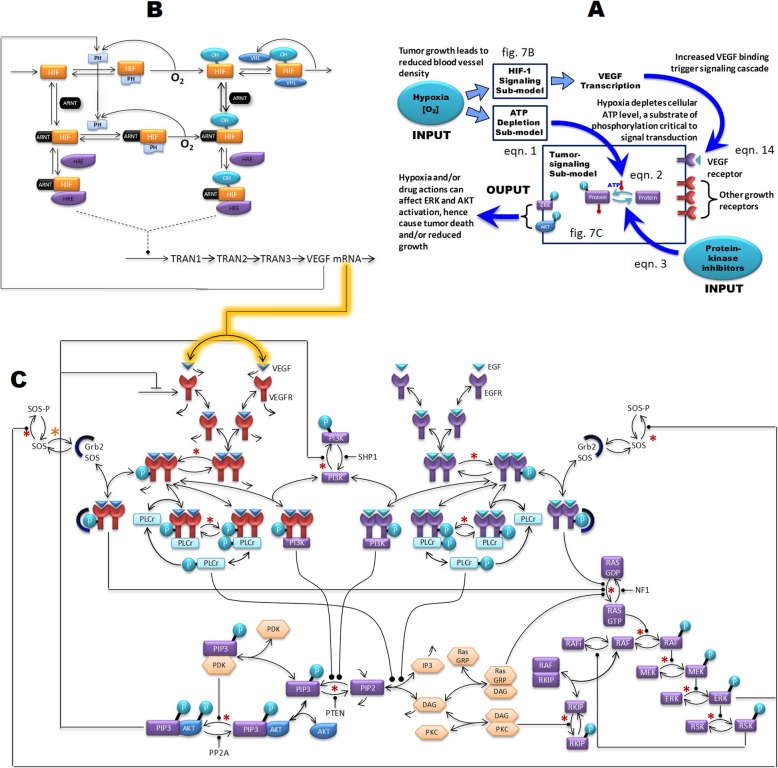
Fig. 7.
The model structure consists of HIF-1α signaling, tumor signaling, and ATP depletion modules. a Summary block diagram of the input, output, and the interaction between core sub-system components. Inputs: hypoxia, drug inhibition of protein kinases and inhibition of VEGF binding. Outputs: ERK and Akt activation. b The kinetic model of the HIF-1α signaling pathway. c The kinetic model of VEG and other growth factor signaling network. Stimulation and inhibition are represented as ─●and ─┤, respectively. Single arrow head toward the species denotes synthesis. The two sub-models were connected by using VEGF mRNA and the output of the HIF-1α signaling pathway model as input to the tumor signaling pathway model to drive VEGF production (arrows with yellow shadow). The hypoxia induced ATP depletion model was linked to the tumor signaling model via additions of ATP-dependent phosphorylation reactions (denoted as *). See Additional files 1 and 2 for more details

