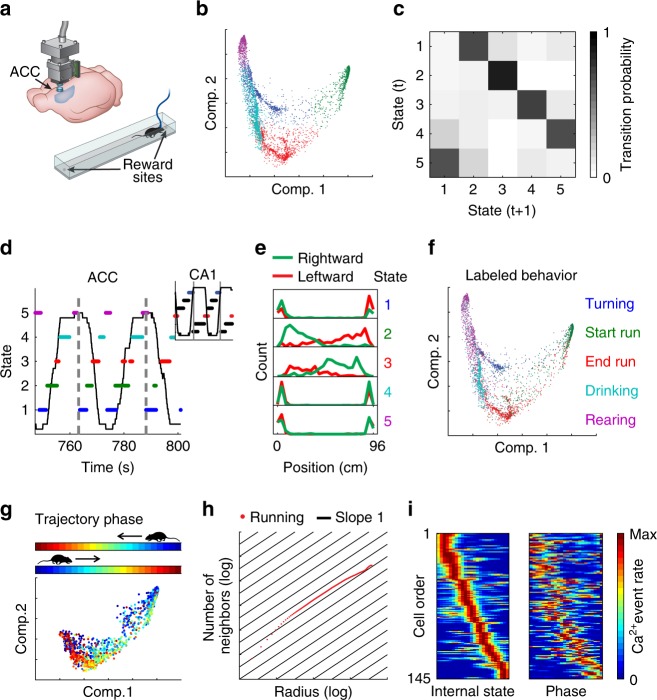
Fig. 2.
ACC activity reveals a schematic representation of behavior along the linear track. a Schematic of Ca2+ imaging via a miniaturized head-mounted microscope in the ACC of a freely behaving mouse. Mice ran back and forth to collect rewards at the two ends of a linear track. b The distribution of data points in the reduced dimensional space of neuronal activity. Each data point corresponds to the neuronal activity within a single time frame. The data are clustered and colored to indicate each of the different network states. c The segment-level transition matrix shows a stereotypical pattern of transitions between the different network states. d A stereotypic temporal structure of network states (marked by different colors) is observed during exploration of the linear track (animal position is shown in black). A full running cycle (bounded between vertical gray lines) corresponds to two cycles of transitions between network states. Inset, hippocampal data in which a full running cycle (bounded between vertical gray lines) corresponds to a single cycle of transitions between network states. e The distribution of mouse position along the linear track is symmetrical for each of the network states. f The same distribution presented in (a) with data points colored according to behavioral labeling. g Distribution of data points in the reduced dimensional space of neuronal activity for the two clusters corresponding to running. Data points are colored according to trajectory phase, i.e., the distance of the mouse from the start of the track (opposite end for each running direction). h Estimation of internal dimension for the data points in (g) (running states). Cumulative number of neighboring data points as a function of the radius threshold in the reduced dimensionality space, plotted on a log–log scale. The slope of the data is close to one (black lines), indicating a dimension of one. i For each neuron, we calculated its internal tuning curve, relative to the internal state of the network (left), and the external tuning curve, relative to the trajectory phase of the animal (right)

