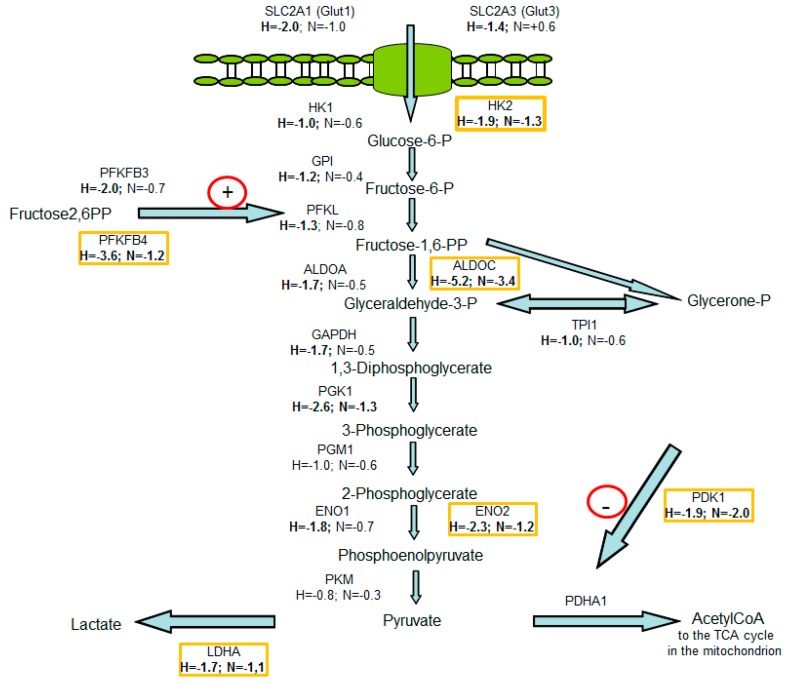
Figure 8.
Gene mRNA levels using deep sequencing data of genes involved in glycolysis after HIF1α was knocked down in the MDA-MB-231 cells. RNA was harvested 24 h after the start of the experiments. The experiments were performed in RPMI 1640 medium without glutamine but with 11.1 mM glucose. In this scheme, the mRNA levels are depicted as a ratio of untreated cells to HIF-siRNA transfected cells either under normoxic (N) or under hypoxic (H) conditions. Deep sequencing analysis was performed while using the hypoxic samples after the application of 5 mM L-glutamine and 1% fetal bovine serum (corresponding to lane 7* in Figure 1) and hypoxic samples that were additionally treated with HIF1α-specific siRNA (corresponding to lane 8* in Figure 1) in four independent experiments. H (hypoxia)-describes the quotients of the transcript level of genes from the hypoxic HIF1-positive samples (corresponding to lane 7* in Figure 1) divided by the transcript level from the hypoxic HIF1-negative samples (corresponding to lane 8* in Figure 1). N (normoxia) describes quotients of the transcript level of the normoxic HIF1-positive samples (corresponding to lane 7 in Figure 1) divided by the transcript level of the normoxic HIF1-negative samples (corresponding to lane 8 in Figure 1). Genes marked yellow were significantly upregulated by HIF1 under normoxic conditions, as was validated using qPCR (Supplemental Figure S16, Supplemental Tables S1 and S2). Figure was adapted from [34].

