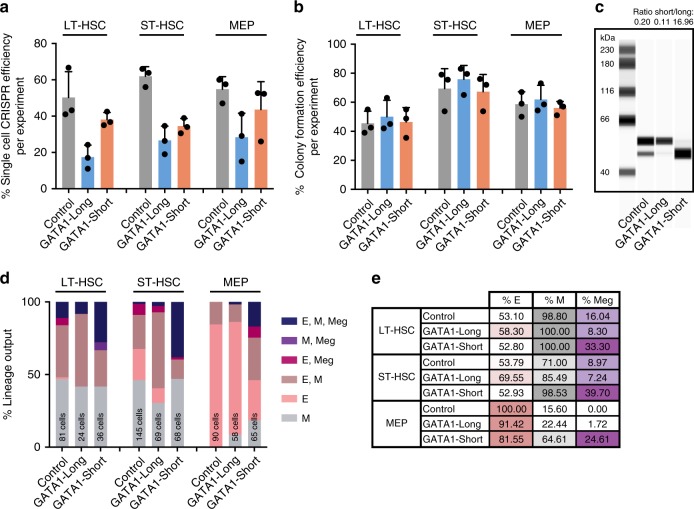
Fig. 2.
Functional interrogation of single CRISPR/Cas9-edited hematopoietic stem cells in vitro. a Percentage of CRISPR/Cas9 efficiency as determined by single cell-derived colonies that were positive for homozygous deletion of exon 1 in control OR2W5, positive for exclusive assignment to the GATA1-Long isoform through HDR-mediated mutation of the alternative start site or positive for exclusive assignment to the GATA1-Short isoform through deletion of exon 2 (n = 3 experiments with independent cord blood pools). b Percentage of single cells that grew into a colony in the single cell in vitro differentiation assays (n = 3 experiments with independent cord blood pools, unpaired t test P < 0.05 for % colony efficiency in LT-HSCs GATA1-Long versus ST-HSCs GATA1-Long). c Capillary-based western assay of GATA1 in bulk MEPs that were CRISPR/Cas9 edited with control, GATA1-Long and GATA1-Short gRNAs and cultured under erythro-myeloid conditions for three days (n = 2 experiments, second western assay is shown in Supplementary Fig. 6a). d Lineage output from the in vitro single cell differentiation assay of individual CRISPR/Cas9-edited LT-HSCs, ST-HSCs and MEPs with control, GATA1-Long and GATA1-Short gRNAs. Numbers of single cell colonies with positive genotype are indicated at each condition (E = erythroid, M = myeloid, Meg = megakaryocytic, n = 3 experiments with independent cord blood pools, number of single cells assessed in each condition is indicated in each bar graph, unpaired t test P < 0.01 for E, M, Meg in GATA1-Short versus control and E, M, Meg in GATA1-Short versus GATA1-Long among all three cell types). e Overall percentage of erythroid, myeloid and megakaryocyte containing colonies from single cell in vitro differentiation assays (E = erythroid, M = myeloid, Meg = megakaryocytic, n = 3 experiments with independent cord blood pools, unpaired t test P < 0.005 for % Meg in GATA1-Short versus Control or % Meg in GATA1-Short versus GATA1-Long among all three cell types). Error bars represent standard deviations

