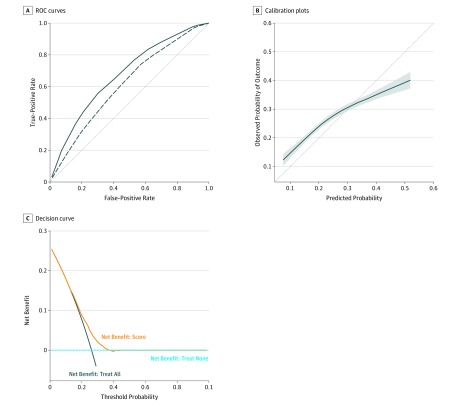
Figure. Development and Validation Cohort Curves.
A, Receiver operating characteristic (ROC) curves in the development (solid line) and validation (dashed line) cohorts. Derivation area under the curve (AUC) = 0.67; and validation AUC = 0.61. The dotted line is the 45° line, which corresponds to the performance of random guesses. B, Calibration plots with a locally estimated scatterplot smoothing curve and 95% CI (shaded area) in the validation cohort. The dotted line is the 45° line, which corresponds to perfect calibration. C, Decision curve in the validation cohort.

