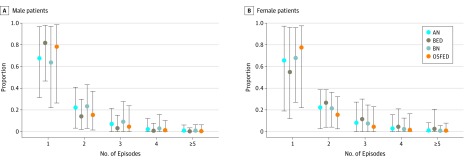
Figure 2. Number of Eating Disorder Episodes by Age 40 Years Among Simulated Individuals With History of Eating Disorder.
Numbers of eating disorder episodes for simulated male (A) and female (B) patients are shown. Circles indicate means; vertical lines, 95% uncertainty intervals. AN indicates anorexia nervosa; BED, binge eating disorder; BN, bulimia nervosa; and OSFED, other specified feeding and eating disorders.

