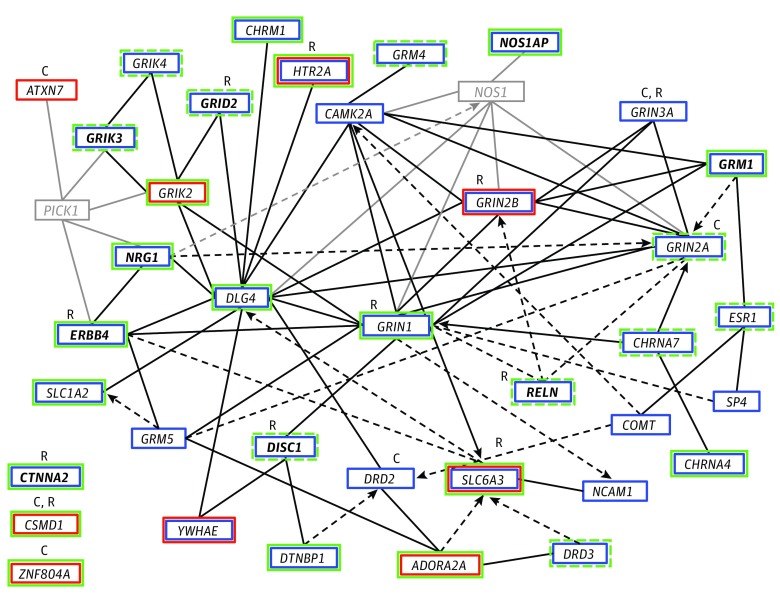
Figure 2. Interaction Network of Genes Identified for the 11 Endophenotypes Through Association and Linkage Analysis of the Consortium on the Genetics of Schizophrenia (COGS) Samples.
Genes are represented as nodes with solid lines representing direct protein-protein interactions and dashed arrows representing more indirect effects on expression, activation, or inhibition. Genes and interactions in black revealed association (blue box) or linkage (red box) with 1 or more endophenotypes, whereas those in gray represent other interacting genes. Those with pleiotropic associations to at least 4 endophenotypes in the COGS families are shown in bold. Genes with additional evidence of association in the genome-wide association study (GWAS) of the independent cases with schizophrenia and healthy comparison participants are indicated in green, with a solid box representing genes meeting the enrichment threshold of P < 1 × 10⁻⁴ and a dashed box representing nominal significance (P < .01). C indicates genes identified as associated with a schizophrenia diagnosis through GWAS of common variants; R, those identified by studies of rare and de novo variation. CTNNA2, CSMD1, and ZNF804A were prominent genes in these analyses with external support from studies of schizophrenia diagnosis but do not directly connect into the defined network.

