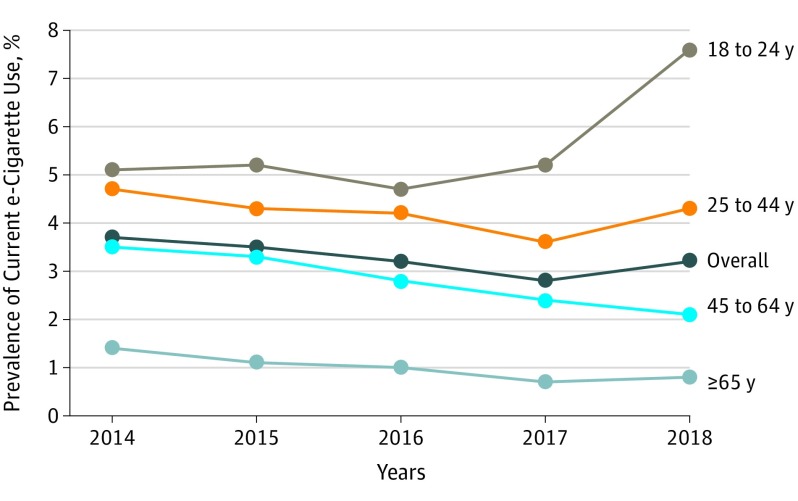
Figure. Prevalence of Current Electronic Cigarette Use Among US Adults, 2014-2018 .
Prevalence estimates were weighted. The number of participants (n = 153 177) was 36 520 in 2014, 31 724 in 2015, 32 931 in 2016, 26 648 in 2017, and 25 354 in 2018. Overall differences in the prevalence of current electronic cigarette use from 2014 to 2018 were significant for the whole population (2014, 3.7% [95% CI, 3.3%-4.1%]; 2015, 3.5% [95% CI, 3.2%-3.7%]; 2016, 3.2% [95% CI, 2.9%-3.5%]; 2017, 2.8% [95% CI, 2.5%-3.1%]; 2018, 3.2% [95% CI, 3.0%-3.5%]; P < .001), adults aged 18 to 24 years (2014, 5.1% [95% CI, 3.5%-6.7%]; 2015, 5.2% [95% CI, 4.2%-6.2%]; 2016, 4.7% [95% CI, 3.5%-5.9%]; 2017, 5.2% [95% CI, 3.9%-6.5%]; 2018, 7.6% [95% CI, 6.1%-9.1%]; P = .02), adults aged 45 to 64 years (2014, 3.5% [95% CI, 2.9%-4.1%]; 2015, 3.3% [95% CI, 2.8%-3.7%]; 2016, 2.8% [95% CI, 2.4%-3.2%]; 2017, 2.4% [95% CI, 2.0%-2.7%]; 2018, 2.1% [95% CI, 1.8%-2.5%]; P < .001), and adults aged 65 years or older (2014, 1.4% [95% CI, 1.1%-1.8%]; 2015, 1.1% [95% CI, 0.8%-1.4%]; 2016, 1.0% [95% CI, 0.7%-1.2%]; 2017, 0.7% [95% CI, 0.5%-0.9%]; 2018, 0.8% [95% CI, 0.6%-1.1%]. The prevalence for adults aged 25 to 44 years did not differ significantly over time.

