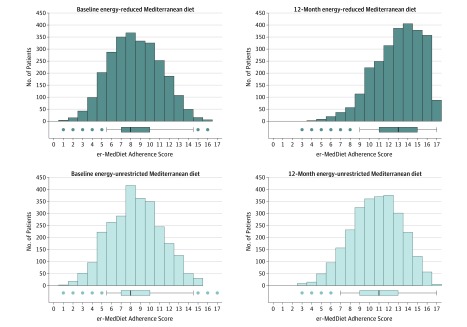
Figure 2. Changes in the Primary End Point of Diet Adherence in a Study of the Effect of an Energy-Reduced Mediterranean Diet (er-MedDiet) Among Adults With Metabolic Syndrome.
Horizontal box plots are shown in which the middle line represents the median er-MedDiet score (range, 0-17; higher score indicates higher adherence), boxes represent the interquartile range (IQR), whiskers extend to the most extreme observed values with 1.5 × IQR of the nearer quartile, and the dots represent observed values outside that range.

