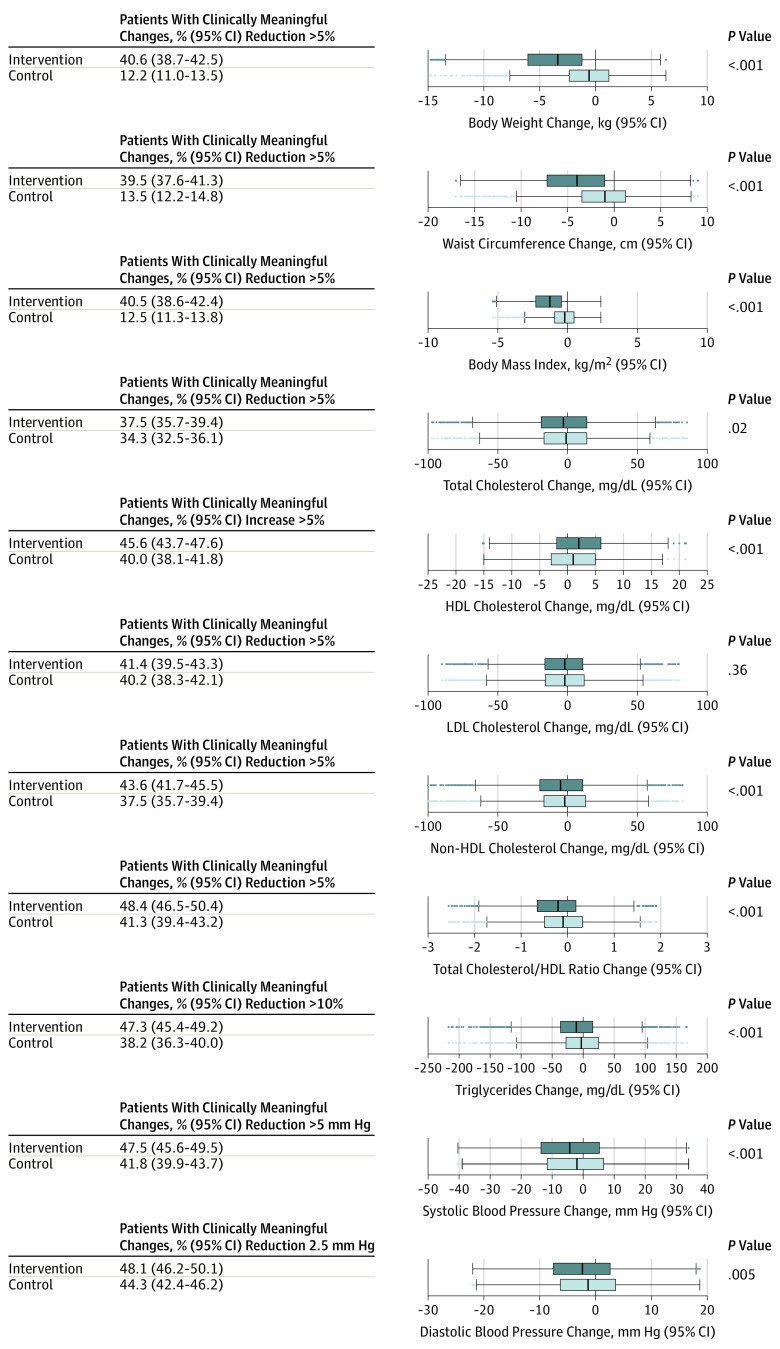
Figure 4. Risk Factors at 12 Months of Follow-up in a Study of the Effect of an Energy-Reduced Mediterranean Diet Among Adults With Metabolic Syndrome.
Horizontal box plots are shown in which the middle line represents the median change in observed risk factors, boxes represent the interquartile range (IQR), whiskers extend to the most extreme observed values with 1.5 × IQR of the nearer quartile, and the dots represent observed values outside that range. HDL indicates high-density lipoprotein; LDL, low-density lipoprotein.

