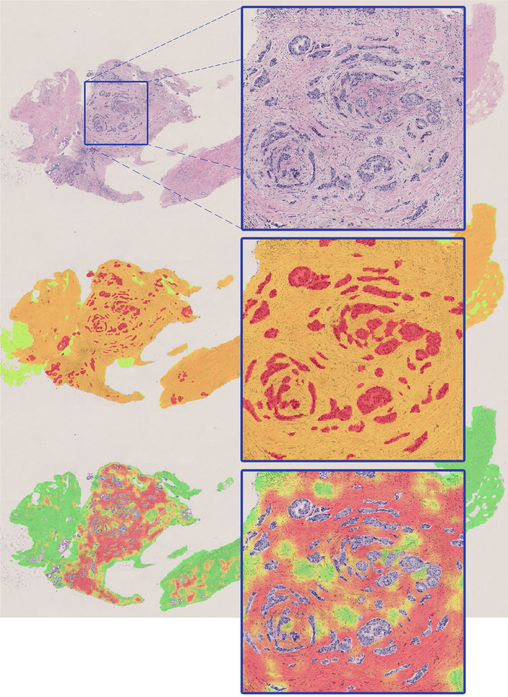
Fig. 1.
Sample classification result by CNN I (middle image) and CNN II (bottom image) for a WSI containing breast cancer. In the middle image, green, orange and red represent fat, stroma, and epithelium, respectively. The bottom image shows the likelihood map representing tumor-stroma probability overlaid on the original image (green represents low probability and red represents high probability of belonging to tumor-associated stroma class).

