
Figure 4.
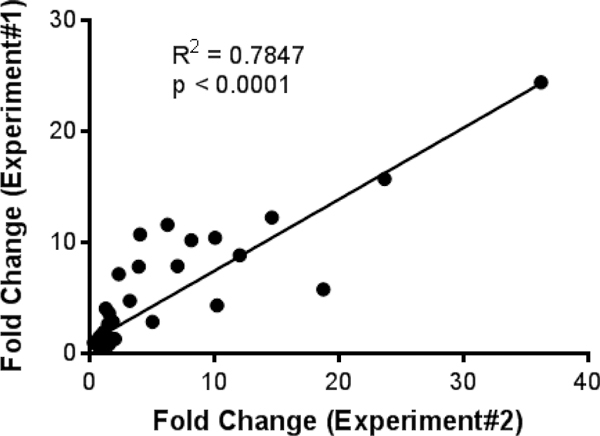
Reproducibility of the 33 cytokine / chemokine expression patterns between two independent experiments. Graph shows the average fold change of upregulated cytokines and chemokines plotted for depleted and non-depleted data from two independent experiments. Linear regression analysis was performed to the best fit line, R2, and p value.