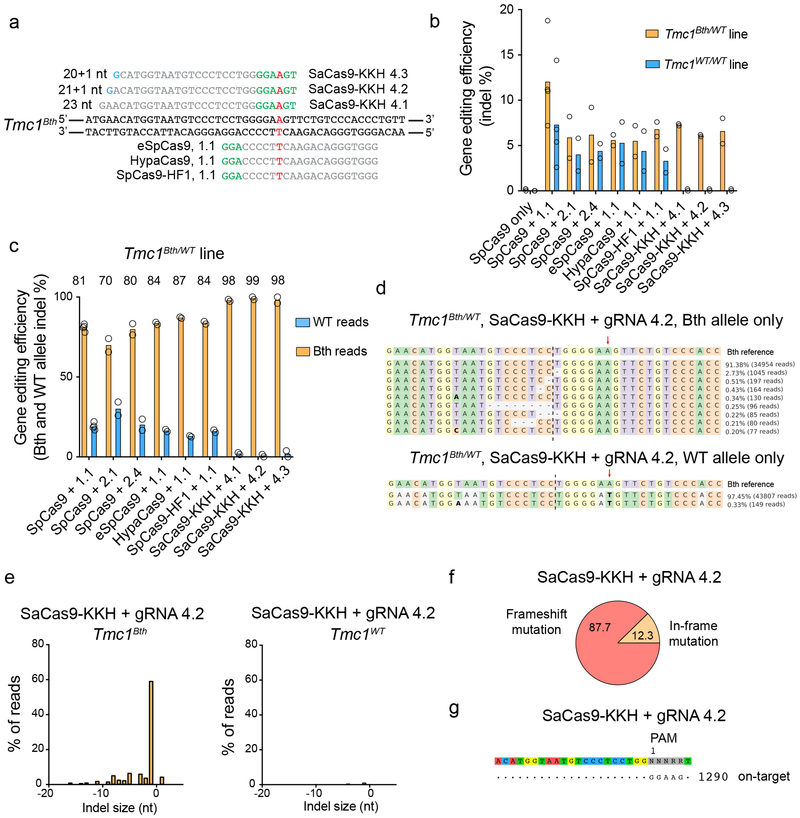
Figure 1:
Targeting Tmc1Bth allele with high-fidelity SpCas9s and SaCas9-KKH. (a) gRNA design. Mutation site is highlighted in red. PAM sites are marked by green nucleotides. Mismatching nucleotides are shown in blue. SaCas9-KKH: KKH PAM variant of SaCas9, eSpCas9(1.1), HypaCas9 and SpCas9-HF1 are different high fidelity variants of SpCas9 (used in combination with 1.1 gRNA, same as on Extended Data Fig. 1a). (b) Indel percent (mean) in Tmc1Bth/WT and Tmc1WT/WT fibroblasts determined by targeted deep-sequencing and CRISPResso analysis. SpCas9 with 1.1, 2.1 and 2.4 gRNA represent the same conditions as on Extended Data Fig. 1 (except that cells were not sorted for GFP expression), however experiments were repeated to allow for head-to-head comparison with SaCas9-KKH and high fidelity SpCas9 enzymes. Cells were transfected on two different occasions (SpCas9 only and SpCas9 + gRNA 1.1 on four occasions) and genomic DNA from two independent biological samples on each transfection day were pooled for sequencing. (c) Allele-specific indel analysis (mean) of the samples from (b) in Tmc1Bth/WT cells. Tmc1Bth and Tmc1WT reads were segregated using a Python script and indel percentages were analyzed for each allele. Thus, one condition represents indel formation in the same population of cells. The numbers above the graphs show specificity towards the Beethoven allele, expressed as percentages. (d) The most abundant reads in the SaCas9-KKH + gRNA 4.2 treated cells, shown separately for Tmc1Bth (top) and Tmc1WT (bottom) reads. The CRISPR cut site is marked by black dashed line. Dashes represent deleted nucleotides. Nucleotides in bold are substitutions, however these were not quantified as CRISPR actions. Sequences were aligned to Bth allele, thus in the bottom panel, WT sequence appears as a substitution (an A to T change). Mutation site is marked by red arrow. (e) Indel profiles from SaCas9-KKH + gRNA-4.2 transfected Tmc1Bth/WT fibroblasts. Tmc1Bth and Tmc1WT reads are plotted separately. Minus numbers represent deletions, plus numbers represent insertions. Sequences without indels (value=0) are omitted from the chart. (f) Indels causing in-frame vs. frame shift mutations (percentages are shown) in the coding sequence after SaCas9-KKH + gRNA 4.2 transfection. (g) GUIDE-Seq analysis on SaCas9-KKH + gRNA 4.2 transfected Tmc1Bth/WT fibroblasts. Genomic DNA was pooled from 3 biological replicates for sequencing on one occasion. The number next to read is read count in the GUIDE-Seq assay.

