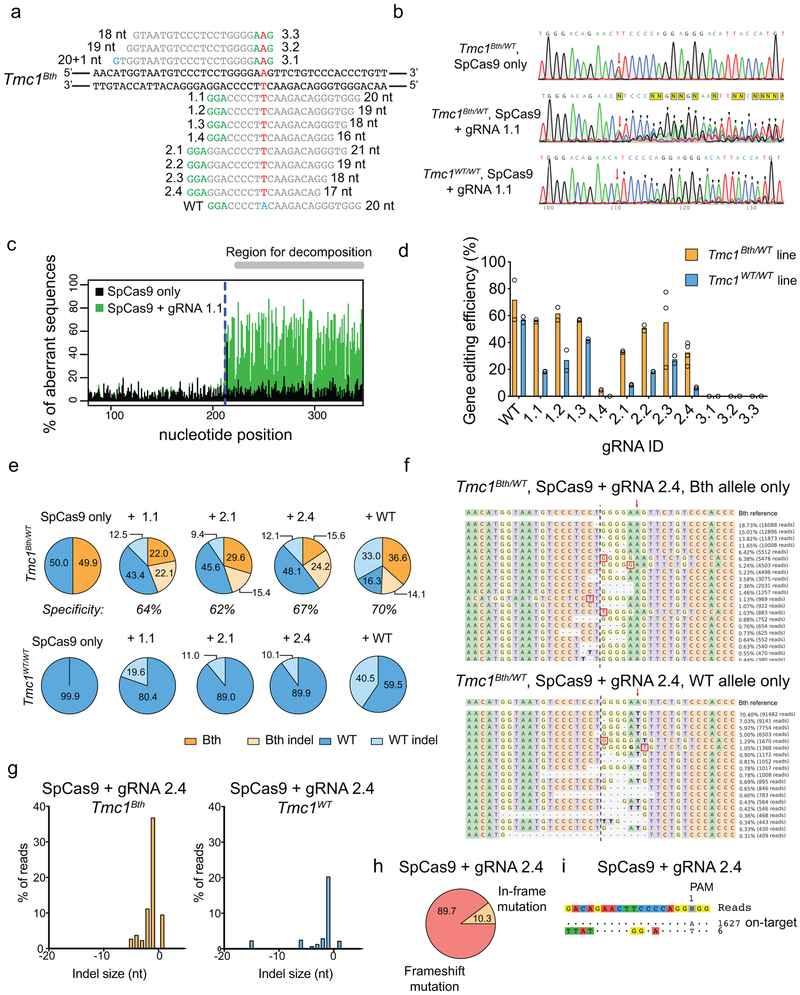
Extended Data Fig. 1:
Targeting Tmc1Bth with SpCas9. (a) gRNA design for SpCas9. Mutation site is highlighted in red. PAM sites are marked by green nucleotides. Mismatching nucleotides are shown in blue. The numbers or letters (e.g. 1.1) next to the PAM site represent gRNAs IDs. Our gRNA 1.1 is identical to the Tmc1-mut3 gRNA in the study of Gao et al16. Plasmids encoding SpCas9-2A-GFP, along with the different gRNAs, were transfected into fibroblasts. Four days after transfection, GFP-positive cells were sorted by FACS (b) Sanger sequencing traces from Tmc1Bth/WT or Tmc1WT/WT mouse fibroblasts transfected with SpCas9-2A-GFP with or without gRNA 1.1. GFP expressing cells were sorted by FACS 4 days after transfection. The mutation site is marked by red arrow. Additional peaks appearing downstream (marked by black arrowheads) of the mutation site demonstrate sequence heterogeneity and thus, indel formation. Similar results were obtained by all gRNAs from two technical replicates (forward and reverse sequencing). Genome editing is apparent both in Tmc1Bth/WT or Tmc1WT/WT cells with SpCas9 + gRNA 1.1. (c) Sanger sequencing data was analyzed by TIDE. The control sample (SpCas9-2A-GFP only, black) and the genome edited sample (SpCas9-2A-GFP + gRNA 1.1, green) are overlaid. Downstream of the expected cut site (blue dashed line) the percentage of aberrant sequences was quantified in the region for decomposition. (d) Indel percentages (mean ± standard deviation) in Tmc1Bth/WT or Tmc1WT/WT cells based on TIDE analysis. Cells were transfected in duplicates and two independent sequencing reactions (forward and reverse) were performed. No indel formation was observed in the case of 3.1, 3.2 and 3.3 gRNAs. gRNA 1.4 showed minimal, but specific genome editing on the Tmc1Bth/WT cells. All the other gRNAs mediated efficient indel formation both in Tmc1Bth/WT or Tmc1WT/WT cells. (e) Targeted deep sequencing on control (SpCas9-2A-GFP only) cells, WT gRNA and the 3 most specific gRNAs (1.1, 2.1 and 2.4) in Tmc1Bth/WT (top) Tmc1WT/WT (bottom) cells. Indels were quantified after segregating Tmc1Bth and Tmc1WT reads by CRISPResso (only insertions and deletions were quantified, substitutions were ignored). None of the gRNAs are specific to the Tmc1Bth allele, and mediate efficient indel formation on the Tmc1WT allele as well (light blue). Sequencing was performed one time from pooled cells, transfected in triplicates. Numbers in pie charts represent the percentage of reads. Specificity was defined as the indel percentage towards the targeted allele among total indels. The gRNA with the highest selectivity towards the Tmc1Bth allele was gRNA 2.4. (f) The most abundant reads in the SpCas9 + gRNA 2.4 treated cells, shown separately for Tmc1Bth (top) and Tmc1WT (bottom) reads. The CRISPR cut site is marked by a black dashed line. Dashes represent deleted nucleotides. Insertions are shown with nucleotides in red squares. Nucleotides in bold are substitutions, however these were not quantified as CRISPR actions. Sequences were aligned to Bth allele, thus in the bottom panel, WT reads appear as having a substitution (a T to A change). Mutation site is marked by red arrow. Indel formation is evident in both Tmc1Bth and Tmc1WT reads. (g) Indel profiles from SpCas9 + gRNA 2.4 transfected Tmc1Bth/WT fibroblasts. Tmc1Bth and Tmc1WT reads are plotted separately. Minus numbers represent deletions, plus numbers represent insertions. Sequences without indels (value=0) are omitted from the chart. The most common indel event is a single base deletion. (h) Indels causing in-frame vs. frame shift mutations (percentages are shown) in the coding sequence after SpCas9 + gRNA 2.4 transfection. (i) GUIDE-Seq analysis on SpCas9 + gRNA 2.4 transfected Tmc1Bth/WT fibroblasts. Genomic DNA was isolated from 3 biological replicates for sequencing on one occasion. Only one off-target site was identified. Numbers next to reads are read counts in the GUIDE-Seq assay.

