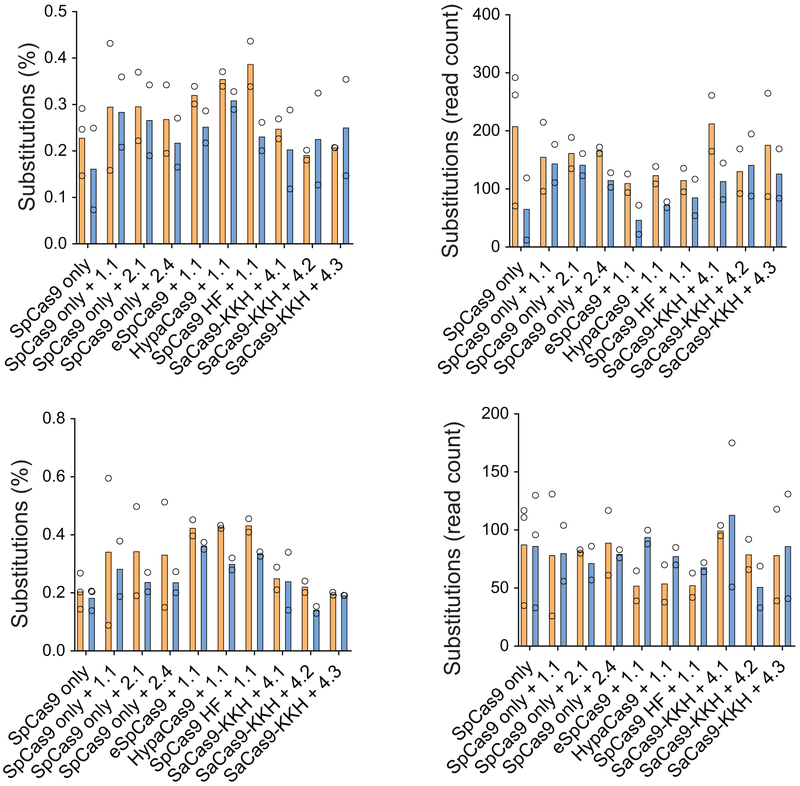
Extended Data Fig. 3.
Single nucleotide substitutions after Cas9+gRNA treatment. Cells were transfected on two different occasions (SpCas9 only and SpCas9 + gRNA 1.1 on four occasions) and genomic DNA from two independent biological samples on each transfection day were pooled for sequencing. Substitutions are given as percentages (i.e. normalized to total read counts) or non-normalized values (i.e. the number of reads with substitutions). Analysis was performed on non-segregated .fastq files in Tmc1Bth/WT cells and in Tmc1WT/WT cells (top) and segregated .fastq files in Tmc1Bth/WT cells (bottom). Experimental conditions are the same as in Fig. 1b. Substitutions were not frequent (0.1-0.5% of reads) and there was no difference between untreated and treated samples in the percentage or number of reads with single nucleotide substitutions.

