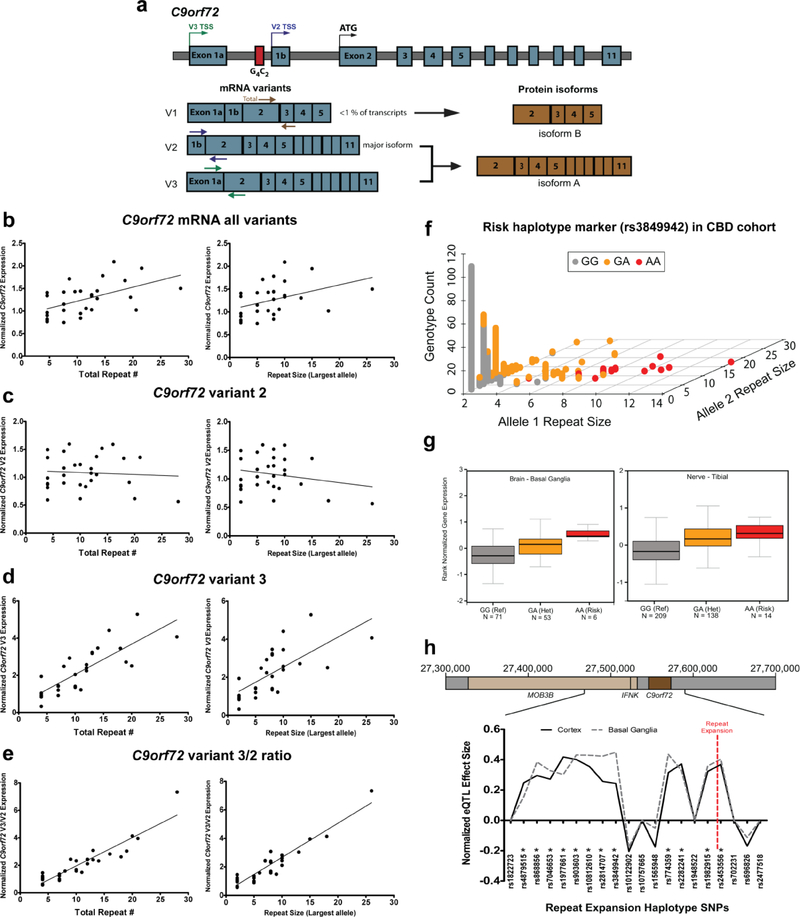
Figure 2: Effect of intermediate repeats on C9orf72 expression.
a) Diagram of the C9orf72 locus with mRNA and protein isoforms. Transcription start sites (TSS) are labeled for each mRNA variant on the genomic DNA. Colored arrows on the mRNA depict primers used for RT-qPCR. b) Correlation between total C9orf72 repeat size (left) or largest allele (right) and C9orf72 mRNA levels from all variants measured by RT-qPCR using RNA from CBD patient cerebellum (Total repeats: n = 29, R2 = 0.276, p = 0.0034; Largest allele: n = 29, R2 = 0.1613, p = 0.0308). Data is normalized to samples with 4 total repeats. c) Correlation between total C9orf72 repeat size (left) or largest allele (right) and variant 2 mRNA levels (Total repeats: n = 29, R2 = 0.00496, p = 0.717; Largest allele: n = 29, R2 = 0.04432, p = 0.2730). d) Correlation between total C9orf72 repeat size (left) or largest allele (right) and variant 3 mRNA levels (Total repeats: n = 29, R2 = 0.667, p < 0.0001; Largest allele: n = 29, R2 = 0.4874, p < 0.0001). e) Correlation between total C9orf72 repeat size (left) or largest allele (right) and the variant 3 mRNA to variant 2 mRNA ratio (Total repeats: n = 29, R2 = 0.849, p < 0.0001; Largest allele: n = 29, R2 = 0.8869, p < 0.0001). f) Genotyping results for rs3849942 in the CBD patient genomic DNA cohort (n = 708 alleles). The A allele is associated with intermediate and full length repeat expansions. g) SNP eQTL data from the Gtex project showing the effect of rs3849942 on C9orf72 expression in basal ganglia (left, p = 9.00E-07) and tibial nerve (right, p = 2.80E-16). For box plots, center line indicates median, boxes are upper and lower quartiles, error bars are standard error of the mean. Numbers of samples are indicated below each group. h) Normalized GTEx eQTL effect size from cortex and basal ganglia on C9orf72 expression for all 20 SNPs in the consensus repeat expansion risk haplotype (from Mok et al. 2012[53]). * indicates SNPs with a significant effect on C9orf72 expression. Red dotted line indicates the location of the C9orf72 repeat expansion.

