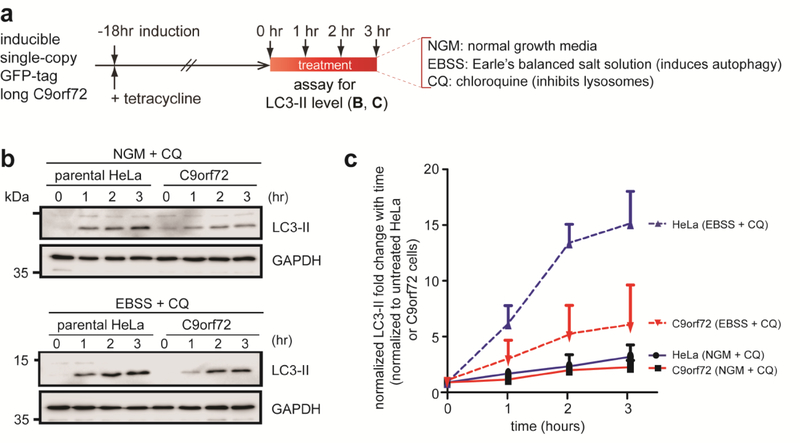
Figure 7. Kinetics of starvation induced autophagy in C9orf72 over-expressing cells.
a) Schematic of time-course experiments on autophagy in C9orf72 HeLa stable cells. b) Representative western blot showing LC3-II expression levels of parental HeLa cells and C9orf72 cells first treated with tetracycline to induce C9orf72 transgene expression then with either normal growth media (NGM)+CQ or EBSS+CQ for 0, 1, 2, and 3 hours. c) Time course chart corresponding to (b) showing pooled data of LC3-II protein levels expressed as fold change over respective controls, i.e. parental HeLa cells or C9orf72 cells grown in normal growth media without CQ treatment. Data represents three independent experiments with error bars representing standard error of the mean (S.E.M).

