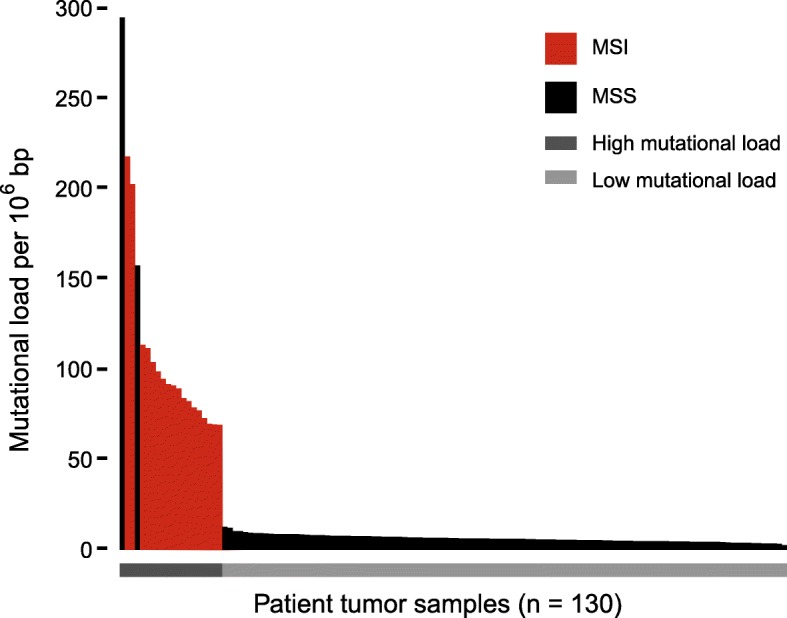
Fig. 2.

Mutational load of tumor samples. Mutational load per million bases (Mb) in tumor. Samples are ordered according to mutational load. Red bars indicate MSI tumors, whereas black bars indicate MSS tumors. Grey lines below the plot indicates the separation between hypermutated samples (dark grey) and samples with low mutational load (light grey)
