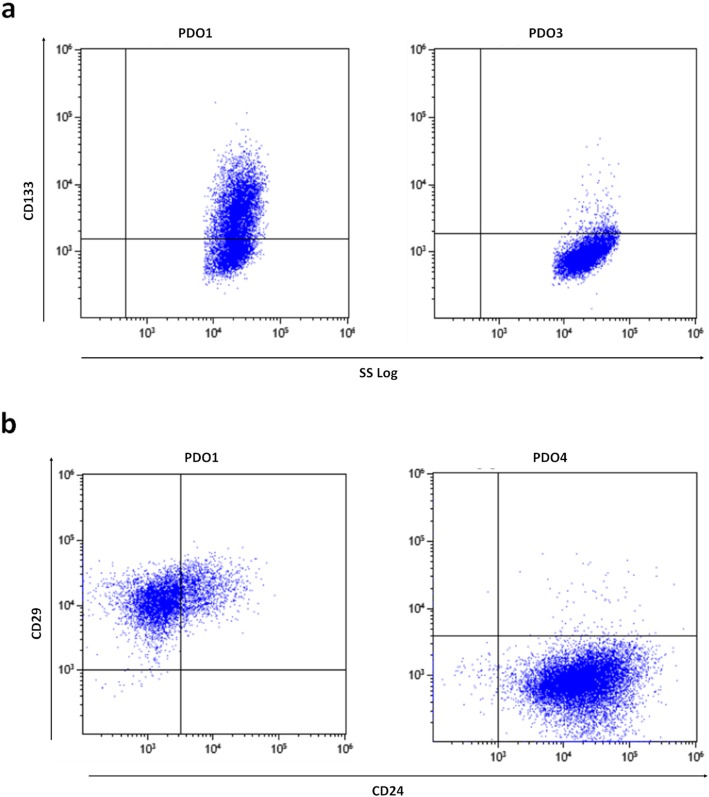
Fig. 5.
Flow cytometry analysis. Flow cytometry analysis of CD133 surface marker (a) and CD29 versus CD24 surface markers (b) on PDOs. Plots on the left are representative of PDO1, plots on the right are representative of PDO3 and 4 respectively, resembling PDO2–5. The plots are representative of more than three independent experiments

