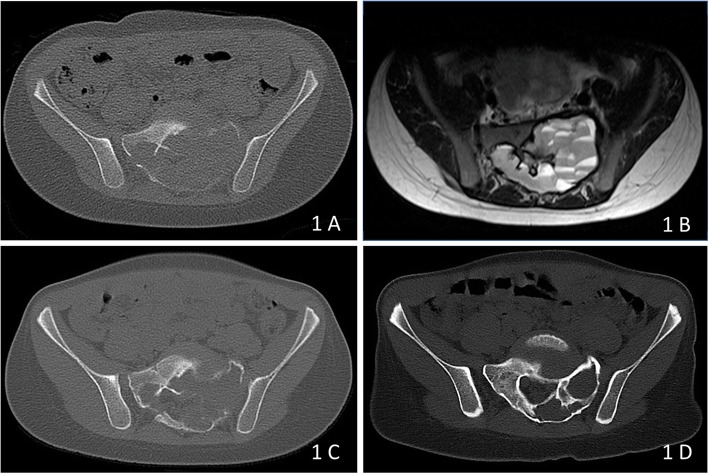
Fig. 1.
a, b: CT-scan (A) showing the massive destruction of the left and also in parts the right sacrum at the levels S1 and S2. The blood filling of the cyst is clearly visible as fluid-fluid levels in the T2-weighted MRI image (b). c: CT-scan 2 months after initiation of treatment showing increasing bone density at the margins of the lesion. d: CT-scan one after 1 year of treatment proofing the total bone restoration in the right and the impressive gain of bone at the left sacrum

